## Bar Charts: Energy per MAC vs. Node Size for VGG19 and YOLOv3
### Overview
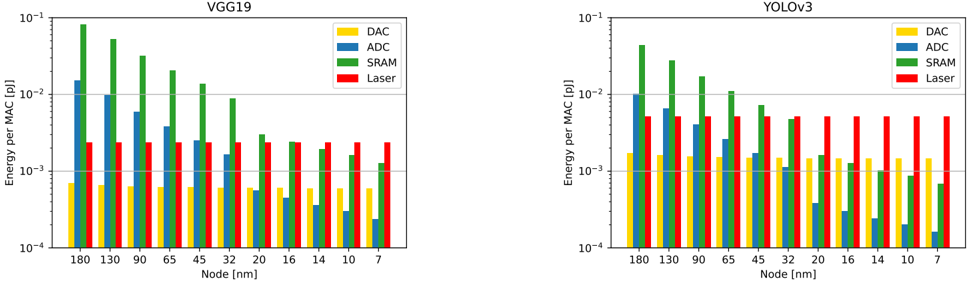
The image presents two bar charts comparing the energy per MAC (multiply-accumulate operation) for different components (DAC, ADC, SRAM, Laser) across various node sizes (180nm to 7nm) for two neural network architectures: VGG19 (left) and YOLOv3 (right). The y-axis represents energy per MAC in picojoules (pJ) on a logarithmic scale, while the x-axis represents the node size in nanometers (nm).
### Components/Axes
**Left Chart (VGG19):**
* **Title:** VGG19
* **Y-axis:** Energy per MAC [pJ] (logarithmic scale)
* Markers: 10<sup>-1</sup>, 10<sup>-2</sup>, 10<sup>-3</sup>, 10<sup>-4</sup>
* **X-axis:** Node [nm] (linear scale)
* Markers: 180, 130, 90, 65, 45, 32, 20, 16, 14, 10, 7
* **Legend (top-right):**
* Yellow: DAC (Digital-to-Analog Converter)
* Blue: ADC (Analog-to-Digital Converter)
* Green: SRAM (Static Random-Access Memory)
* Red: Laser
**Right Chart (YOLOv3):**
* **Title:** YOLOv3
* **Y-axis:** Energy per MAC [pJ] (logarithmic scale)
* Markers: 10<sup>-1</sup>, 10<sup>-2</sup>, 10<sup>-3</sup>, 10<sup>-4</sup>
* **X-axis:** Node [nm] (linear scale)
* Markers: 180, 130, 90, 65, 45, 32, 20, 16, 14, 10, 7
* **Legend (top-right):**
* Yellow: DAC (Digital-to-Analog Converter)
* Blue: ADC (Analog-to-Digital Converter)
* Green: SRAM (Static Random-Access Memory)
* Red: Laser
### Detailed Analysis
**VGG19 Chart:**
* **SRAM (Green):** The energy consumption of SRAM decreases as the node size decreases.
* 180nm: ~0.04 pJ
* 7nm: ~0.008 pJ
* **ADC (Blue):** The energy consumption of ADC decreases as the node size decreases.
* 180nm: ~0.015 pJ
* 7nm: ~0.002 pJ
* **Laser (Red):** The energy consumption of Laser decreases as the node size decreases.
* 180nm: ~0.005 pJ
* 7nm: ~0.001 pJ
* **DAC (Yellow):** The energy consumption of DAC decreases as the node size decreases.
* 180nm: ~0.001 pJ
* 7nm: ~0.0005 pJ
**YOLOv3 Chart:**
* **SRAM (Green):** The energy consumption of SRAM is relatively constant across different node sizes.
* Ranges between ~0.004 pJ and ~0.008 pJ
* **ADC (Blue):** The energy consumption of ADC is relatively constant across different node sizes.
* Ranges between ~0.0005 pJ and ~0.002 pJ
* **Laser (Red):** The energy consumption of Laser is relatively constant across different node sizes.
* Ranges between ~0.004 pJ and ~0.008 pJ
* **DAC (Yellow):** The energy consumption of DAC is relatively constant across different node sizes.
* Ranges between ~0.001 pJ and ~0.002 pJ
### Key Observations
* For VGG19, energy consumption for all components decreases as node size decreases. SRAM consistently has the highest energy consumption, followed by ADC, Laser, and DAC.
* For YOLOv3, energy consumption for all components remains relatively constant across different node sizes. DAC consistently has the lowest energy consumption, while SRAM and Laser have the highest.
* The energy consumption of SRAM is significantly higher than other components in VGG19, especially at larger node sizes.
* The energy consumption of ADC is significantly lower than other components in YOLOv3, especially at larger node sizes.
### Interpretation
The charts illustrate the impact of node size on the energy efficiency of different components within VGG19 and YOLOv3 neural network architectures. The VGG19 chart suggests that reducing node size can significantly improve the energy efficiency of all components, particularly SRAM. In contrast, the YOLOv3 chart indicates that energy consumption is less dependent on node size for this architecture. This could be due to differences in the architecture, memory access patterns, or other factors. The data suggests that optimizing memory components like SRAM is crucial for improving the overall energy efficiency of neural networks, especially for architectures like VGG19. The relatively constant energy consumption in YOLOv3 might indicate that other factors, such as data transfer or computational complexity, are more dominant in determining energy consumption for this architecture.