\n
## Bar Chart: Energy per MAC vs. Node Size for VGG19 and YOLOv3
### Overview
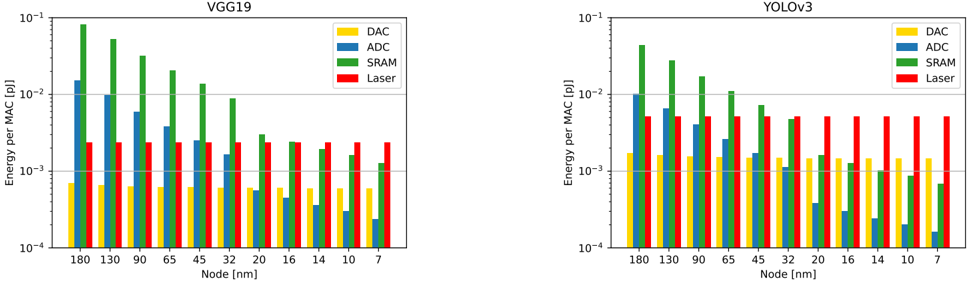
The image presents two bar charts comparing the energy consumption per Multiply-Accumulate (MAC) operation for different hardware components (DAC, ADC, SRAM, Laser) across varying node sizes (180nm to 7nm) for two neural network models: VGG19 and YOLOv3. The Y-axis represents energy in picojoules (pJ), displayed on a logarithmic scale, while the X-axis represents the node size in nanometers (nm).
### Components/Axes
* **X-axis (Both Charts):** Node [nm] - with markers at 180, 130, 90, 65, 45, 32, 20, 16, 14, 7.
* **Y-axis (Both Charts):** Energy per MAC [pJ] - Logarithmic scale from 10^-4 to 10^-1.
* **Legend (Both Charts):**
* Yellow: DAC
* Blue: ADC
* Green: SRAM
* Red: Laser
* **Chart Titles:**
* Left Chart: VGG19
* Right Chart: YOLOv3
### Detailed Analysis - VGG19 Chart
The VGG19 chart displays energy consumption for each component across the specified node sizes.
* **Laser (Red):** The Laser component exhibits a generally decreasing trend in energy consumption as the node size decreases from 180nm to 7nm. Approximate values:
* 180nm: ~8 x 10^-2 pJ
* 130nm: ~6 x 10^-2 pJ
* 90nm: ~5 x 10^-2 pJ
* 65nm: ~4 x 10^-2 pJ
* 45nm: ~3 x 10^-2 pJ
* 32nm: ~2.5 x 10^-2 pJ
* 20nm: ~2 x 10^-2 pJ
* 16nm: ~1.6 x 10^-2 pJ
* 14nm: ~1.4 x 10^-2 pJ
* 7nm: ~1 x 10^-2 pJ
* **SRAM (Green):** SRAM shows a similar decreasing trend, but generally consumes less energy than the Laser component. Approximate values:
* 180nm: ~4 x 10^-2 pJ
* 130nm: ~3 x 10^-2 pJ
* 90nm: ~2.5 x 10^-2 pJ
* 65nm: ~2 x 10^-2 pJ
* 45nm: ~1.7 x 10^-2 pJ
* 32nm: ~1.4 x 10^-2 pJ
* 20nm: ~1.2 x 10^-2 pJ
* 16nm: ~1 x 10^-2 pJ
* 14nm: ~9 x 10^-3 pJ
* 7nm: ~7 x 10^-3 pJ
* **ADC (Blue):** ADC exhibits a decreasing trend, but its energy consumption is relatively low compared to Laser and SRAM. Approximate values:
* 180nm: ~1.5 x 10^-2 pJ
* 130nm: ~1.2 x 10^-2 pJ
* 90nm: ~1 x 10^-2 pJ
* 65nm: ~8 x 10^-3 pJ
* 45nm: ~6 x 10^-3 pJ
* 32nm: ~5 x 10^-3 pJ
* 20nm: ~4 x 10^-3 pJ
* 16nm: ~3 x 10^-3 pJ
* 14nm: ~2.5 x 10^-3 pJ
* 7nm: ~2 x 10^-3 pJ
* **DAC (Yellow):** DAC consistently has the lowest energy consumption across all node sizes. Approximate values:
* 180nm: ~3 x 10^-3 pJ
* 130nm: ~2.5 x 10^-3 pJ
* 90nm: ~2 x 10^-3 pJ
* 65nm: ~1.5 x 10^-3 pJ
* 45nm: ~1.2 x 10^-3 pJ
* 32nm: ~1 x 10^-3 pJ
* 20nm: ~8 x 10^-4 pJ
* 16nm: ~7 x 10^-4 pJ
* 14nm: ~6 x 10^-4 pJ
* 7nm: ~5 x 10^-4 pJ
### Detailed Analysis - YOLOv3 Chart
The YOLOv3 chart displays energy consumption for each component across the specified node sizes.
* **Laser (Red):** Similar to VGG19, the Laser component shows a decreasing trend in energy consumption as node size decreases. Approximate values:
* 180nm: ~7 x 10^-2 pJ
* 130nm: ~5 x 10^-2 pJ
* 90nm: ~4 x 10^-2 pJ
* 65nm: ~3 x 10^-2 pJ
* 45nm: ~2.5 x 10^-2 pJ
* 32nm: ~2 x 10^-2 pJ
* 20nm: ~1.6 x 10^-2 pJ
* 16nm: ~1.3 x 10^-2 pJ
* 14nm: ~1.1 x 10^-2 pJ
* 7nm: ~8 x 10^-3 pJ
* **SRAM (Green):** SRAM also exhibits a decreasing trend, with lower energy consumption than Laser. Approximate values:
* 180nm: ~3 x 10^-2 pJ
* 130nm: ~2.5 x 10^-2 pJ
* 90nm: ~2 x 10^-2 pJ
* 65nm: ~1.6 x 10^-2 pJ
* 45nm: ~1.3 x 10^-2 pJ
* 32nm: ~1 x 10^-2 pJ
* 20nm: ~8 x 10^-3 pJ
* 16nm: ~7 x 10^-3 pJ
* 14nm: ~6 x 10^-3 pJ
* 7nm: ~5 x 10^-3 pJ
* **ADC (Blue):** ADC shows a decreasing trend, with relatively low energy consumption. Approximate values:
* 180nm: ~1 x 10^-2 pJ
* 130nm: ~8 x 10^-3 pJ
* 90nm: ~6 x 10^-3 pJ
* 65nm: ~5 x 10^-3 pJ
* 45nm: ~4 x 10^-3 pJ
* 32nm: ~3 x 10^-3 pJ
* 20nm: ~2.5 x 10^-3 pJ
* 16nm: ~2 x 10^-3 pJ
* 14nm: ~1.7 x 10^-3 pJ
* 7nm: ~1.5 x 10^-3 pJ
* **DAC (Yellow):** DAC consistently has the lowest energy consumption across all node sizes. Approximate values:
* 180nm: ~2 x 10^-3 pJ
* 130nm: ~1.6 x 10^-3 pJ
* 90nm: ~1.2 x 10^-3 pJ
* 65nm: ~1 x 10^-3 pJ
* 45nm: ~8 x 10^-4 pJ
* 32nm: ~6 x 10^-4 pJ
* 20nm: ~5 x 10^-4 pJ
* 16nm: ~4 x 10^-4 pJ
* 14nm: ~3.5 x 10^-4 pJ
* 7nm: ~3 x 10^-4 pJ
### Key Observations
* Energy consumption generally decreases as the node size decreases for all components in both VGG19 and YOLOv3.
* Laser consistently consumes the most energy, followed by SRAM, ADC, and DAC.
* The energy consumption difference between VGG19 and YOLOv3 is noticeable, with YOLOv3 generally exhibiting lower energy consumption for all components at each node size.
* The logarithmic scale emphasizes the relative changes in energy consumption, particularly at smaller node sizes.
### Interpretation
The data demonstrates the impact of technology scaling on energy consumption in neural network computations. As node sizes decrease, the energy required for each MAC operation decreases for all hardware components. This is expected due to reduced transistor sizes and improved circuit designs. The consistent ranking of components (Laser > SRAM > ADC > DAC) suggests inherent differences in their energy efficiency. The lower energy consumption of YOLOv3 compared to VGG19 could be attributed to its more efficient network architecture, requiring fewer MAC operations for the same task. The logarithmic scale highlights that the energy savings become more significant at smaller node sizes, indicating the continued importance of technology scaling for energy-efficient AI hardware. The data suggests that optimizing the Laser component is crucial for reducing overall energy consumption in these neural network models.