## Grouped Bar Charts: Energy per MAC for VGG19 and YOLOv3 Across Technology Nodes
### Overview
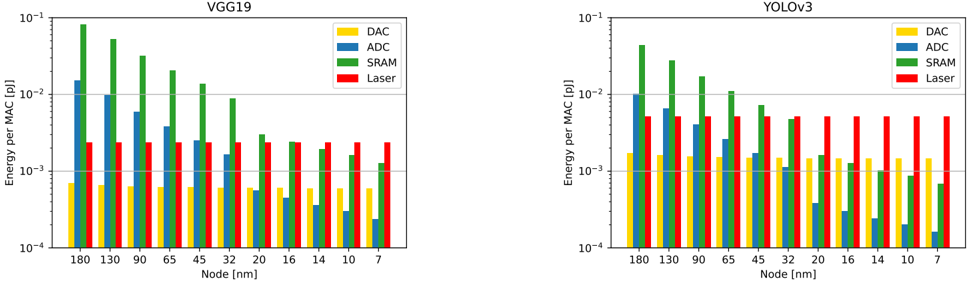
The image contains two side-by-side grouped bar charts comparing the energy consumption per Multiply-Accumulate operation (MAC) for four hardware components (DAC, ADC, SRAM, Laser) across ten different semiconductor technology nodes (from 180 nm down to 7 nm). The left chart is for the VGG19 neural network model, and the right chart is for the YOLOv3 model. The y-axis uses a logarithmic scale.
### Components/Axes
* **Chart Titles:** "VGG19" (left), "YOLOv3" (right).
* **Y-axis (Both Charts):** Label: "Energy per MAC [pJ]". Scale: Logarithmic, ranging from 10⁻⁴ to 10⁻¹ picojoules (pJ). Major ticks at 10⁻⁴, 10⁻³, 10⁻², 10⁻¹.
* **X-axis (Both Charts):** Label: "Node [nm]". Categories (from left to right): 180, 130, 90, 65, 45, 32, 20, 16, 14, 10, 7.
* **Legend (Top-Right of each chart):**
* Yellow bar: "DAC" (Digital-to-Analog Converter)
* Blue bar: "ADC" (Analog-to-Digital Converter)
* Green bar: "SRAM" (Static Random-Access Memory)
* Red bar: "Laser"
### Detailed Analysis
**Data Series Trends & Approximate Values (Visual Estimation from Log Scale):**
**VGG19 Chart (Left):**
* **SRAM (Green):** Dominant energy consumer at larger nodes. Shows a strong, consistent downward trend. Starts highest at ~9 x 10⁻² pJ (180 nm) and decreases to ~1.2 x 10⁻³ pJ (7 nm).
* **ADC (Blue):** Second highest at larger nodes. Also shows a clear downward trend. Starts at ~1.5 x 10⁻² pJ (180 nm) and decreases to ~2.5 x 10⁻⁴ pJ (7 nm).
* **Laser (Red):** Relatively constant across all nodes. Hovers between ~2 x 10⁻³ and ~3 x 10⁻³ pJ, showing minimal scaling benefit.
* **DAC (Yellow):** Lowest energy consumer. Shows a slight downward trend. Starts at ~7 x 10⁻⁴ pJ (180 nm) and decreases to ~4 x 10⁻⁴ pJ (7 nm).
**YOLOv3 Chart (Right):**
* **SRAM (Green):** Again the dominant consumer at larger nodes, with a strong downward trend. Starts at ~4 x 10⁻² pJ (180 nm) and decreases to ~7 x 10⁻⁴ pJ (7 nm).
* **ADC (Blue):** Shows a very steep downward trend. Starts at ~1 x 10⁻² pJ (180 nm) and drops dramatically to the lowest value on the chart, ~1.5 x 10⁻⁴ pJ (7 nm).
* **Laser (Red):** Similar to VGG19, remains nearly constant across nodes, between ~4 x 10⁻³ and ~5 x 10⁻³ pJ.
* **DAC (Yellow):** Shows a moderate downward trend. Starts at ~1.5 x 10⁻³ pJ (180 nm) and decreases to ~1.2 x 10⁻³ pJ (7 nm).
### Key Observations
1. **Dominant Component Shift:** At large nodes (180 nm, 130 nm), SRAM is the overwhelming energy cost for both models. As nodes shrink, its contribution falls dramatically.
2. **Laser Energy Invariance:** The energy per MAC for the "Laser" component is remarkably stable across all technology nodes for both models, suggesting it does not benefit from traditional CMOS scaling.
3. **ADC Scaling:** The ADC component shows the most dramatic reduction in energy with scaling, especially for YOLOv3, where it becomes the most efficient component at the 7 nm node.
4. **Model Comparison:** YOLOv3 generally shows higher Laser energy consumption than VGG19. The relative energy ordering of components (SRAM > ADC > Laser > DAC at large nodes) is consistent between models, but the exact values differ.
### Interpretation
This data illustrates the changing energy bottlenecks in hardware accelerators for neural networks as semiconductor technology advances. The charts demonstrate that memory (SRAM) and data conversion (ADC) energy costs scale favorably with smaller transistors, while the energy associated with the "Laser" component (likely representing optical interconnects or a specific photonic component) does not scale. This implies that for future, highly-scaled technology nodes (e.g., 7 nm and beyond), the non-scaling components like the Laser could become the dominant energy cost, fundamentally shifting the design constraints for energy-efficient AI hardware. The difference between VGG19 and YOLOv3 suggests the model's architecture influences the absolute energy breakdown, but the scaling trends are consistent.