## Line Chart: Gibbs Error and Generalization Error vs. Iterations
### Overview
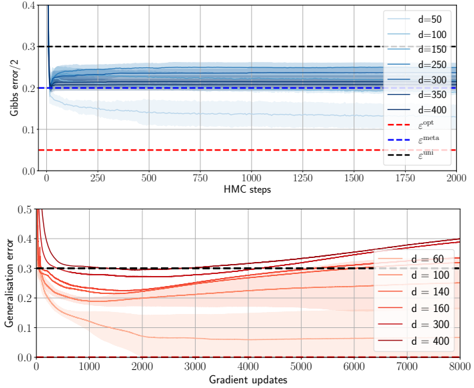
The image presents two line charts, stacked vertically. The top chart displays the Gibbs error (halved) as a function of Hamiltonian Monte Carlo (HMC) steps, while the bottom chart shows the generalization error as a function of gradient updates. Both charts compare performance across different values of a parameter 'd'. The charts are grayscale, but the legend uses color to differentiate the lines.
### Components/Axes
**Top Chart:**
* **X-axis:** HMC steps (0 to 2000, approximately). Labeled "HMC steps".
* **Y-axis:** Gibbs error / 2 (0 to 0.4, approximately). Labeled "Gibbs error/2".
* **Legend:** Located in the top-right corner. Contains the following labels and corresponding colors:
* d = 50 (lightest blue)
* d = 100 (slightly darker blue)
* d = 150 (medium blue)
* d = 250 (darker blue)
* d = 300 (even darker blue)
* d = 350 (darkest blue)
* d = 400 (very darkest blue)
* ε<sub>opt</sub> (red, dashed)
* ε<sub>meta</sub> (red, dash-dot)
* ε<sub>min</sub> (black, dashed)
**Bottom Chart:**
* **X-axis:** Gradient updates (0 to 7000, approximately). Labeled "Gradient updates".
* **Y-axis:** Generalization error (0 to 0.4, approximately). Labeled "Generalisation error".
* **Legend:** Located in the bottom-right corner. Contains the following labels and corresponding colors:
* d = 60 (lightest red)
* d = 100 (slightly darker red)
* d = 140 (medium red)
* d = 160 (darker red)
* d = 300 (even darker red)
* d = 400 (darkest red)
### Detailed Analysis or Content Details
**Top Chart (Gibbs Error):**
* All lines representing different 'd' values start at approximately 0.32 and generally decrease.
* The line for d = 50 initially decreases rapidly, then plateaus around 0.25.
* The lines for d = 100, 150, 250, 300, 350, and 400 all show a similar decreasing trend, converging towards a value around 0.18-0.22. The convergence appears faster for larger 'd' values.
* ε<sub>opt</sub> (red, dashed) is a horizontal line at approximately 0.16.
* ε<sub>meta</sub> (red, dash-dot) is a horizontal line at approximately 0.20.
* ε<sub>min</sub> (black, dashed) is a horizontal line at approximately 0.26.
**Bottom Chart (Generalization Error):**
* All lines start at approximately 0.32 and generally decrease.
* The line for d = 60 decreases rapidly initially, then plateaus around 0.25.
* The lines for d = 100, 140, 160, 300, and 400 all show a decreasing trend, converging towards a value around 0.18-0.22. The convergence appears faster for larger 'd' values.
* The lines appear to converge to a similar level as the top chart.
### Key Observations
* Increasing 'd' generally leads to faster convergence in both charts.
* The Gibbs error and generalization error both decrease with increasing HMC steps and gradient updates, respectively.
* The errors appear to approach a minimum value, potentially representing an optimal solution.
* The values of ε<sub>opt</sub>, ε<sub>meta</sub>, and ε<sub>min</sub> provide benchmarks for the performance of the different 'd' values.
### Interpretation
The charts demonstrate the impact of the parameter 'd' on the convergence of HMC and gradient descent algorithms. A larger 'd' appears to facilitate faster convergence to a lower error state in both the Gibbs error and generalization error metrics. This suggests that 'd' controls the complexity or capacity of the model, and increasing it allows for more efficient learning. The horizontal lines representing ε<sub>opt</sub>, ε<sub>meta</sub>, and ε<sub>min</sub> likely represent theoretical limits or benchmarks for the error, with ε<sub>opt</sub> being the optimal error, ε<sub>meta</sub> representing a meta-learning bound, and ε<sub>min</sub> representing a minimum achievable error. The convergence of the lines for larger 'd' values towards these benchmarks indicates that the algorithms are approaching their optimal performance. The similar behavior in both charts suggests a relationship between Gibbs error and generalization error, potentially indicating that reducing Gibbs error leads to improved generalization performance.