## Flowchart: Data Flow Process
### Overview
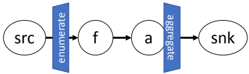
The image depicts a sequential data flow process represented as a flowchart. It consists of four primary components connected by directional arrows, with two intermediate processing steps labeled "enumerate" and "aggregate". The flow progresses from left to right, indicating a transformation pipeline.
### Components/Axes
1. **Nodes**:
- **src**: Oval-shaped node on the far left, labeled "src" (source)
- **f**: Oval-shaped node connected to "src", labeled "f" (function)
- **a**: Oval-shaped node connected to "f", labeled "a" (aggregation)
- **snk**: Oval-shaped node on the far right, labeled "snk" (sink)
2. **Processing Steps**:
- **enumerate**: Blue vertical rectangle between "src" and "f", labeled "enumerate"
- **aggregate**: Blue vertical rectangle between "f" and "a", labeled "aggregate"
3. **Connectors**:
- Black arrows indicate directional flow between all components
- Arrows maintain consistent thickness and style throughout
4. **Visual Style**:
- White background
- Black text for labels
- Blue rectangles for processing steps with white text
- Oval shapes for nodes with black borders
### Detailed Analysis
- **src → enumerate → f**: Data originates at "src", undergoes enumeration processing, then passes through function "f"
- **f → aggregate → a**: Processed data moves through aggregation step before reaching node "a"
- **a → snk**: Final data transfer to the sink node "snk"
- All components maintain equal vertical alignment, creating a straight horizontal flow
### Key Observations
1. The process follows a strict linear progression without branching or feedback loops
2. Processing steps are visually distinguished by blue rectangles, while nodes use oval shapes
3. No numerical values or quantitative data present in the diagram
4. Consistent use of black for structural elements (arrows, node borders, text)
5. Blue color specifically reserved for processing steps, creating visual hierarchy
### Interpretation
This flowchart represents a typical data processing pipeline where:
1. Raw data ("src") is first enumerated (likely converted into a sequence/collection)
2. The enumerated data undergoes functional transformation ("f")
3. Results are aggregated before reaching intermediate node "a"
4. Final output is delivered to the sink ("snk")
The diagram suggests a batch processing model where data is transformed through discrete stages. The use of "enumerate" and "aggregate" implies potential operations like:
- Enumeration: Indexing or converting to a sequence
- Aggregation: Summarizing or combining data elements
The absence of feedback loops or parallel processing paths indicates a strictly sequential workflow, which might be optimized for simplicity or specific data characteristics requiring ordered processing.