## Diagram: Mechanism Representation
### Overview
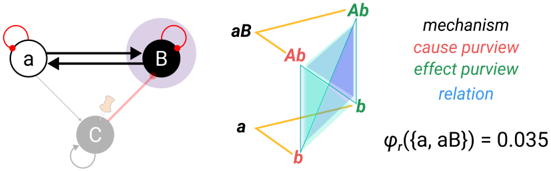
The image presents two diagrams illustrating a mechanism. The left diagram is a state transition diagram showing relationships between states labeled 'a', 'B', and 'C'. The right diagram is a geometric representation of the mechanism, with labels 'a', 'b', 'Ab', and 'aB'. A legend explains the color-coding used to represent cause purview, effect purview, and relation. Finally, a mathematical expression is provided.
### Components/Axes
**Left Diagram (State Transition Diagram):**
* Nodes: 'a' (white), 'B' (black), 'C' (gray)
* Edges:
* 'a' to 'B' (black, bidirectional)
* 'a' to 'C' (gray)
* Self-loop on 'a' (red)
* Self-loop on 'B' (red, partially obscured by purple circle)
* Self-loop on 'C' (gray, faint)
* 'B' to 'C' (red, faint)
* Purple circle around 'B'
**Right Diagram (Geometric Representation):**
* Nodes: 'a', 'b', 'Ab', 'aB'
* Edges:
* 'a' to 'Ab' (orange)
* 'a' to 'b' (orange)
* 'Ab' to 'aB' (orange)
* 'b' to 'aB' (orange)
* 'Ab' to 'b' (blue shaded area)
* 'a' to 'aB' (blue shaded area)
* Color Legend (top-right):
* "mechanism" (black)
* "cause purview" (red)
* "effect purview" (green)
* "relation" (blue)
**Mathematical Expression:**
* φr({a, aB}) = 0.035
### Detailed Analysis or ### Content Details
**Left Diagram:**
* Node 'a' has a bidirectional relationship with node 'B'.
* Node 'a' has a unidirectional relationship with node 'C'.
* Nodes 'a', 'B', and 'C' each have self-loops.
* Node 'B' is surrounded by a purple circle.
**Right Diagram:**
* The nodes 'a', 'b', 'Ab', and 'aB' form a geometric structure.
* The orange lines represent connections between 'a' and 'Ab', 'a' and 'b', 'Ab' and 'aB', and 'b' and 'aB'.
* The blue shaded area represents the relation between 'Ab' and 'b', and 'a' and 'aB'.
**Mathematical Expression:**
* The expression φr({a, aB}) = 0.035 assigns a value of 0.035 to the relation between 'a' and 'aB'.
### Key Observations
* The left diagram represents state transitions, while the right diagram represents a geometric abstraction of the mechanism.
* The color legend clarifies the meaning of the colors used in the right diagram.
* The mathematical expression quantifies a specific relationship within the mechanism.
### Interpretation
The image illustrates a mechanism using two different representations: a state transition diagram and a geometric abstraction. The state transition diagram shows the relationships between different states, while the geometric abstraction provides a visual representation of the mechanism's components and their interactions. The color legend helps to interpret the geometric abstraction, and the mathematical expression quantifies a specific relationship within the mechanism. The purple circle around node 'B' in the left diagram may indicate a specific property or characteristic of that state. The value 0.035 likely represents the strength or probability of the relation between 'a' and 'aB'.