## Network and Geometric Diagram: Causal and Relational Mechanisms
### Overview
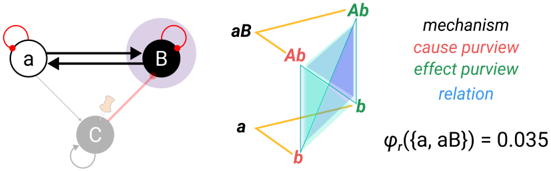
The image combines two interconnected diagrams: a network diagram on the left and a 3D geometric structure on the right. Both are annotated with labels, color-coded relationships, and a mathematical equation. The network diagram illustrates directional relationships between nodes, while the 3D structure visualizes abstract causal and relational pathways.
---
### Components/Axes
#### Network Diagram (Left)
- **Nodes**:
- `a` (black circle with red outline)
- `B` (black circle with red outline)
- `C` (gray circle with red pin)
- **Edges**:
- Bidirectional arrows between `a` and `B` (black lines).
- Unidirectional arrow from `C` to `B` (black line).
- Red circular annotations on `a` and `B`.
- **Legend**:
- **Red**: "cause purview"
- **Green**: "effect purview"
- **Blue**: "relation"
- **Yellow**: "mechanism"
#### 3D Geometric Diagram (Right)
- **Vertices**:
- `a`, `b`, `Ab`, `Ab`, `aB`, `Ab` (labels repeated, possibly indicating hierarchical or layered relationships).
- **Edges**:
- Yellow lines connecting `a` to `b`, `a` to `aB`, and `b` to `Ab`.
- Red lines connecting `aB` to `Ab` and `Ab` to `b`.
- Green lines connecting `Ab` to `aB` and `Ab` to `b`.
- Blue lines connecting `aB` to `Ab` and `a` to `b`.
- **Planes**:
- Intersecting triangular planes in red, green, and blue, suggesting multidimensional relationships.
- **Equation**:
- `φ_r({a, aB}) = 0.035` (positioned near the 3D structure).
---
### Detailed Analysis
#### Network Diagram
- **Directionality**:
- Bidirectional arrows between `a` and `B` imply mutual influence or feedback.
- Unidirectional arrow from `C` to `B` suggests a one-way causal or mechanistic relationship.
- **Annotations**:
- Red circles on `a` and `B` may highlight their centrality or significance in the network.
- Gray node `C` with a red pin could denote an external or secondary influence.
#### 3D Geometric Diagram
- **Color-Coded Relationships**:
- **Red (cause purview)**: Links `aB` to `Ab` and `Ab` to `b`.
- **Green (effect purview)**: Links `Ab` to `aB` and `Ab` to `b`.
- **Blue (relation)**: Links `aB` to `Ab` and `a` to `b`.
- **Yellow (mechanism)**: Connects `a` to `b` and `a` to `aB`.
- **Equation**:
- `φ_r({a, aB}) = 0.035` quantifies the relational strength between `a` and `aB`, suggesting a weak or specialized interaction.
---
### Key Observations
1. **Bidirectional Influence**: The mutual arrows between `a` and `B` indicate a reciprocal relationship, possibly a feedback loop.
2. **External Influence**: Node `C` acts as an external driver affecting `B`, with no reciprocal connection.
3. **3D Complexity**: The geometric structure’s intersecting planes and color-coded edges suggest layered or multidimensional interactions.
4. **Weak Relation**: The equation `φ_r({a, aB}) = 0.035` implies a low relational strength between `a` and `aB`, potentially indicating a niche or indirect connection.
---
### Interpretation
The diagrams collectively model a system where entities `a`, `B`, and `C` interact through causal, effectual, and relational mechanisms. The network diagram emphasizes directional flows, while the 3D structure abstracts these interactions into geometric relationships. The red pin on `C` and the equation’s value (`0.035`) highlight specific nodes and relationships as critical or quantitatively defined. The use of color (red for cause, green for effect, blue for relation) aligns with the legend, reinforcing the categorization of interactions. This could represent a theoretical framework for analyzing systems with interdependent components, such as ecological networks, social systems, or computational models.