## Line Chart: Off-Policy GRPO with fixed batch for 10 iterations from πk
### Overview
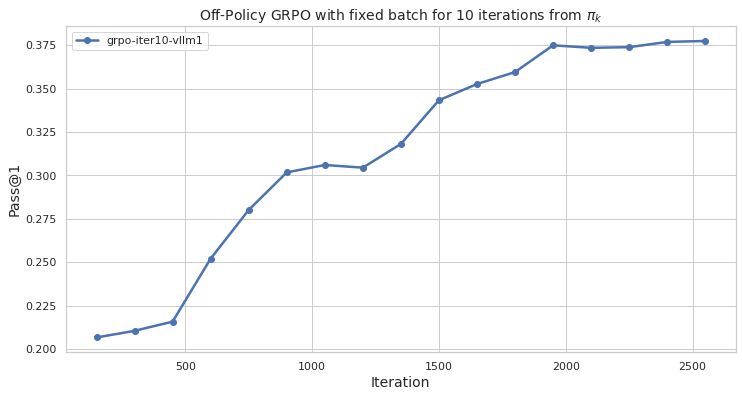
The image is a line chart that displays the performance of an Off-Policy GRPO (Gradient Ratio Policy Optimization) algorithm with a fixed batch size over 10 iterations. The x-axis represents the iteration number, and the y-axis represents the "Pass@1" metric, which likely indicates the success rate of the algorithm in some task. The chart shows how the Pass@1 metric changes as the algorithm iterates.
### Components/Axes
* **Title:** "Off-Policy GRPO with fixed batch for 10 iterations from πk"
* **X-axis:**
* Label: "Iteration"
* Scale: 0 to 2500, with markers at 500, 1000, 1500, 2000, and 2500.
* **Y-axis:**
* Label: "Pass@1"
* Scale: 0.200 to 0.375, with markers at 0.200, 0.225, 0.250, 0.275, 0.300, 0.325, 0.350, and 0.375.
* **Legend:** Located in the top-left corner.
* "grpo-iter10-vllm1" - Represented by a blue line with circular markers.
### Detailed Analysis
The chart contains one data series: "grpo-iter10-vllm1".
* **grpo-iter10-vllm1 (Blue Line):**
* The line starts at approximately (100, 0.207).
* The line increases to approximately (500, 0.215).
* The line increases sharply to approximately (600, 0.252).
* The line increases sharply to approximately (800, 0.280).
* The line increases to approximately (1000, 0.303).
* The line remains relatively constant to approximately (1200, 0.304).
* The line increases to approximately (1400, 0.317).
* The line increases sharply to approximately (1500, 0.343).
* The line increases to approximately (1700, 0.354).
* The line increases to approximately (1900, 0.360).
* The line increases to approximately (2000, 0.374).
* The line remains relatively constant to approximately (2200, 0.374).
* The line increases to approximately (2500, 0.377).
### Key Observations
* The "grpo-iter10-vllm1" series shows a general upward trend, indicating that the Pass@1 metric improves as the number of iterations increases.
* The most significant increase in Pass@1 occurs between iterations 500 and 800.
* After approximately 2000 iterations, the improvement in Pass@1 becomes marginal, suggesting that the algorithm may be approaching a point of diminishing returns.
### Interpretation
The data suggests that the Off-Policy GRPO algorithm is effective in improving the Pass@1 metric over the course of 10 iterations. The initial iterations lead to rapid improvements, but the rate of improvement slows down as the algorithm converges. This information is valuable for understanding the performance characteristics of the algorithm and for determining the optimal number of iterations to run in practice. The algorithm seems to plateau around 0.375 Pass@1 after 2000 iterations, suggesting a possible performance ceiling. Further investigation might explore alternative optimization strategies or hyperparameter tuning to overcome this limitation.