\n
## Line Chart: Off-Policy GRPO Performance
### Overview
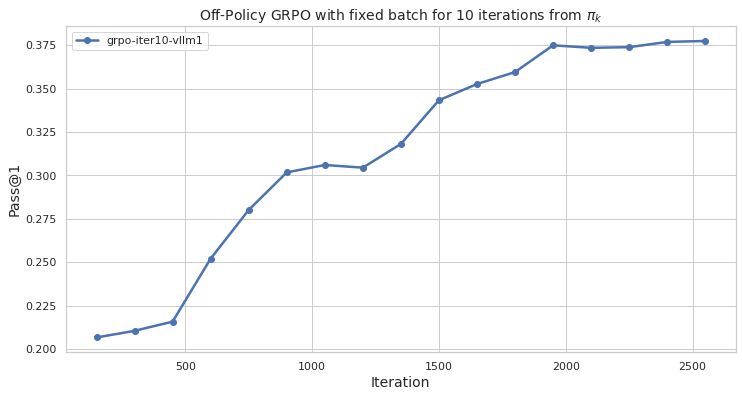
The image presents a line chart illustrating the performance of an Off-Policy GRPO algorithm with a fixed batch size over 10 iterations, evaluated using the Pass@1 metric. The chart plots Pass@1 against the iteration number, showing how the algorithm's performance changes as it iterates.
### Components/Axes
* **Title:** "Off-Policy GRPO with fixed batch for 10 iterations from πk" - positioned at the top-center of the chart.
* **X-axis:** "Iteration" - ranging from approximately 0 to 2500, with gridlines.
* **Y-axis:** "Pass@1" - ranging from approximately 0.200 to 0.375, with gridlines.
* **Legend:** Located at the top-left corner of the chart. It contains a single entry:
* "grpo-iter10-vllm1" - associated with a blue line.
### Detailed Analysis
The chart displays a single data series represented by a blue line. The line generally slopes upward, indicating an increase in Pass@1 as the iteration number increases.
Here's a breakdown of approximate data points, verified by matching the line color to the legend:
* Iteration 0: Pass@1 ≈ 0.205
* Iteration 500: Pass@1 ≈ 0.235
* Iteration 1000: Pass@1 ≈ 0.305
* Iteration 1500: Pass@1 ≈ 0.325
* Iteration 2000: Pass@1 ≈ 0.360
* Iteration 2500: Pass@1 ≈ 0.370
The line exhibits a steeper increase between iterations 500 and 1000, then a more gradual increase from 1000 to 2500. There is a slight flattening of the curve between iterations 1500 and 2000.
### Key Observations
* The algorithm demonstrates a clear positive trend in Pass@1 as the number of iterations increases.
* The most significant performance gain occurs within the first 1000 iterations.
* The rate of improvement slows down after iteration 1000, suggesting diminishing returns.
* The final Pass@1 value plateaus around 0.37, indicating a potential convergence point.
### Interpretation
The chart suggests that the Off-Policy GRPO algorithm with a fixed batch size effectively improves its performance (as measured by Pass@1) with increasing iterations. The initial rapid improvement likely reflects the algorithm quickly learning from the data. The subsequent slower improvement suggests the algorithm is approaching an optimal solution or encountering limitations in the data or algorithm itself. The plateau at the end indicates that further iterations may not yield substantial performance gains. This data could be used to determine an appropriate number of iterations to train the algorithm, balancing performance gains with computational cost. The use of "πk" in the title suggests this is a policy iteration process, and the algorithm is learning from a sequence of policies. The "vllm1" component of the legend likely refers to a specific version or configuration of the algorithm.