\n
## Line Chart: Off-Policy GRPO Performance Over Iterations
### Overview
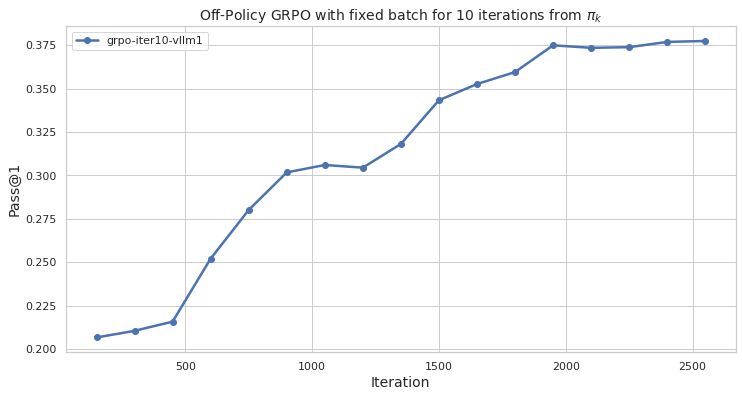
The image is a line chart titled "Off-Policy GRPO with fixed batch for 10 iterations from π_k". It plots a performance metric, "Pass@1", against training "Iteration" for a single data series. The chart shows a generally increasing trend, indicating improvement in the measured metric over the course of the iterations.
### Components/Axes
* **Chart Title:** "Off-Policy GRPO with fixed batch for 10 iterations from π_k"
* **X-Axis:**
* **Label:** "Iteration"
* **Scale:** Linear scale from 0 to 2500.
* **Major Tick Marks:** 0, 500, 1000, 1500, 2000, 2500.
* **Y-Axis:**
* **Label:** "Pass@1"
* **Scale:** Linear scale from 0.200 to 0.375.
* **Major Tick Marks:** 0.200, 0.225, 0.250, 0.275, 0.300, 0.325, 0.350, 0.375.
* **Legend:**
* **Position:** Top-left corner of the plot area.
* **Label:** "grpo-iter10-vllm1"
* **Symbol:** A blue line with a circular marker.
* **Data Series:** A single blue line with circular markers at each data point, corresponding to the legend entry "grpo-iter10-vllm1".
### Detailed Analysis
The line chart tracks the "Pass@1" metric across approximately 16 distinct iteration points. The trend is predominantly upward, with a few periods of slower growth or plateau.
**Approximate Data Points (Iteration, Pass@1):**
* (~100, 0.205)
* (~300, 0.210)
* (~450, 0.215)
* (~600, 0.250)
* (~750, 0.280)
* (~900, 0.300)
* (~1050, 0.305)
* (~1200, 0.303) - *Slight dip or plateau*
* (~1350, 0.318)
* (~1500, 0.343)
* (~1650, 0.353)
* (~1800, 0.360)
* (~1950, 0.375) - *Reaches peak value*
* (~2100, 0.373) - *Slight decrease*
* (~2250, 0.374)
* (~2400, 0.376)
* (~2550, 0.376) - *Final point, stable at peak*
**Trend Verification:**
1. **Initial Phase (Iterations 0-500):** The line shows a gentle, positive slope, rising from ~0.205 to ~0.215.
2. **Rapid Growth Phase (Iterations 500-1000):** The slope steepens significantly, indicating accelerated improvement. The value climbs from ~0.215 to ~0.300.
3. **Plateau/Minor Dip (Iterations 1000-1200):** The line flattens, with a very slight decrease observed around iteration 1200.
4. **Second Growth Phase (Iterations 1200-1950):** The upward trend resumes, though the slope is less steep than the initial rapid phase. Performance increases from ~0.303 to the peak of ~0.375.
5. **Final Plateau (Iterations 1950-2550):** After reaching the peak, the line stabilizes, fluctuating minimally between ~0.373 and ~0.376.
### Key Observations
* **Overall Positive Trend:** The primary observation is a strong, positive correlation between the number of iterations and the Pass@1 score.
* **Non-Linear Improvement:** The rate of improvement is not constant. The most significant gains occur between iterations 500 and 1000.
* **Performance Plateau:** The metric appears to reach a saturation point or plateau after approximately 1950 iterations, with negligible gains thereafter.
* **Minor Fluctuations:** Small dips or plateaus (e.g., around iteration 1200 and 2100) are present but do not alter the overall upward trajectory.
### Interpretation
This chart demonstrates the learning curve of an "Off-Policy GRPO" (likely a reinforcement learning or optimization algorithm) training process. The "Pass@1" metric is a common measure of success in tasks like code generation or problem-solving, indicating the rate at which the model's top-ranked output is correct.
The data suggests that the training process is effective, as the model's performance improves substantially with more iterations. The rapid growth phase indicates a period of efficient learning. The subsequent plateau suggests the model is approaching its performance limit under the given fixed batch and 10-iteration constraint from the policy π_k. The final stable phase implies that further iterations beyond ~2000 yield diminishing returns for this specific metric and configuration.
The title's mention of "fixed batch for 10 iterations from π_k" provides critical context: this is likely an evaluation of an off-policy algorithm's stability or performance when trained on a static dataset (a fixed batch) derived from a previous policy (π_k). The chart validates that the algorithm can successfully learn and improve from this fixed data batch over many iterations.