# Technical Document: Pre-Deployment Decision Framework for LLM Critic-Based Intervention
This document provides a comprehensive extraction of the data and logic contained within the "Pre-Deployment Decision Framework" infographic. The framework outlines a two-step process for determining whether to deploy an LLM critic-based intervention based on pilot study results.
---
## 1. Header Information
* **Main Title:** Pre-Deployment Decision Framework
* **Subtitle:** For LLM Critic-Based Intervention
---
## 2. Main Framework Flow
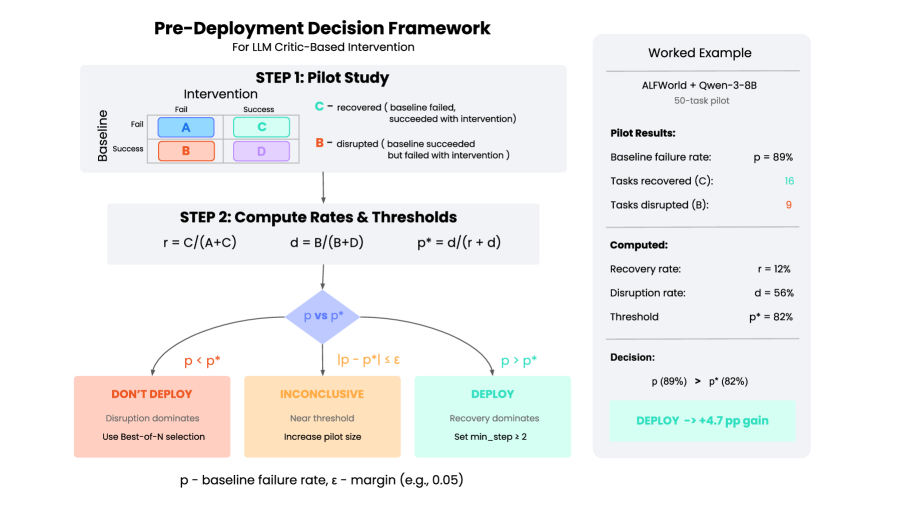
### STEP 1: Pilot Study
This section defines the categorization of outcomes when comparing a **Baseline** model against an **Intervention** model.
#### Outcome Matrix (2x2 Table)
The matrix crosses Baseline results (Rows) with Intervention results (Columns).
| Baseline \ Intervention | Fail | Success |
| :--- | :---: | :---: |
| **Fail** | **A** (Blue) | **C** (Green) |
| **Success** | **B** (Orange) | **D** (Purple) |
#### Key Definitions
* **C - recovered:** Baseline failed, but succeeded with intervention. (Highlighted in Green)
* **B - disrupted:** Baseline succeeded, but failed with intervention. (Highlighted in Orange)
---
### STEP 2: Compute Rates & Thresholds
This section provides the mathematical formulas required for the decision logic.
* **Recovery Rate ($r$):** $r = C / (A + C)$
* **Disruption Rate ($d$):** $d = B / (B + D)$
* **Threshold ($p^*$):** $p^* = d / (r + d)$
---
### Decision Logic (Flowchart)
The framework uses a central decision node comparing **$p$ vs $p^*$**.
* **$p$**: Baseline failure rate.
* **$\epsilon$**: Margin (e.g., 0.05).
| Condition | Decision | Description | Recommendation |
| :--- | :--- | :--- | :--- |
| **$p < p^*$** | **DON'T DEPLOY** | Disruption dominates | Use Best-of-N selection |
| **$|p - p^*| \le \epsilon$** | **INCONCLUSIVE** | Near threshold | Increase pilot size |
| **$p > p^*$** | **DEPLOY** | Recovery dominates | Set min_step $\ge$ 2 |
---
## 3. Worked Example (Sidebar)
A practical application of the framework is provided in the right-hand panel.
### Context
* **Environment/Model:** ALFWorld + Qwen-3-8B
* **Scope:** 50-task pilot
### Pilot Results
* **Baseline failure rate ($p$):** 89%
* **Tasks recovered (C):** 16 (Text in Green)
* **Tasks disrupted (B):** 9 (Text in Orange)
### Computed Values
* **Recovery rate ($r$):** 12%
* **Disruption rate ($d$):** 56%
* **Threshold ($p^*$):** 82%
### Final Decision
* **Comparison:** $p$ (89%) > $p^*$ (82%)
* **Outcome:** **DEPLOY -> +4.7 pp gain** (Highlighted in Green)
---
## 4. Component Isolation & Spatial Grounding
* **Header:** Contains the title and subtitle.
* **Main Chart (Left/Center):** Contains the two-step process and the decision tree.
* The **Matrix** is located at the top left.
* The **Formulas** are centered below the matrix.
* The **Decision Nodes** are at the bottom, color-coded to match the matrix (Orange for "Don't Deploy", Green for "Deploy").
* **Worked Example (Right):** A grey-shaded vertical box containing specific data points and a final calculation.
* **Footer:** Contains variable definitions for $p$ and $\epsilon$.
## 5. Trend and Logic Verification
* **Logic Check:** The framework suggests that deployment is only favorable when the baseline failure rate ($p$) is high enough to outweigh the risk of the intervention disrupting tasks that the baseline would have otherwise solved.
* **Visual Consistency:** The color **Green** consistently represents positive outcomes (Recovery, Success, Deploy), while **Orange** represents negative outcomes (Disruption, Fail, Don't Deploy). The "Inconclusive" state is represented by a neutral **Yellow/Tan**.