# Pre-Deployment Decision Framework for LLM Critic-Based Intervention
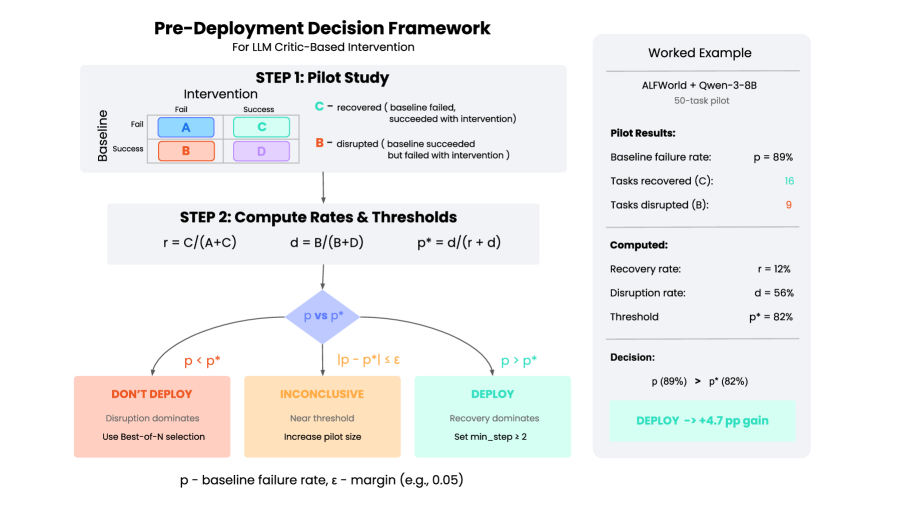
## Step 1: Pilot Study
### Intervention Matrix
| Baseline \ Intervention | Success (C) | Fail (D) |
|-------------------------|-------------|----------|
| Success (A) | Recovered (C) | Disrupted (B) |
| Fail (B) | Disrupted (B) | Baseline Failure (A) |
**Color Coding**:
- **Blue (A)**: Baseline Success, Intervention Failure
- **Orange (B)**: Baseline Failure, Intervention Success
- **Green (C)**: Baseline Failure, Intervention Success (Recovered)
- **Purple (D)**: Baseline Success, Intervention Failure (Disrupted)
### Example: ALFWorld + Qwen-3-8B
- **Pilot Configuration**: 50-task pilot
- **Pilot Results**:
- Baseline failure rate: `p = 89%`
- Tasks recovered (C): `16`
- Tasks disrupted (B): `9`
## Step 2: Compute Rates & Thresholds
### Formulas
- Recovery rate: `r = C / (A + C)`
- Disruption rate: `d = B / (B + D)`
- Threshold: `p* = d / (r + d)`
### Decision Tree
1. **Threshold Comparison**:
- If `p < p*`: **DON'T DEPLOY** (Disruption dominates)
- If `|p - p*| ≤ ε`: **INCONCLUSIVE** (Near threshold)
- If `p > p*`: **DEPLOY** (Recovery dominates)
2. **Actionable Outcomes**:
- **DON'T DEPLOY**: Use Best-of-N selection
- **INCONCLUSIVE**: Increase pilot size
- **DEPLOY**: Set `min_step ≥ 2`
### Example Computation
- **Computed Metrics**:
- Recovery rate: `r = 12%`
- Disruption rate: `d = 56%`
- Threshold: `p* = 82%`
- **Decision**:
- `p (89%) > p* (82%)` → **DEPLOY** with `+4.7 pp gain`
## Spatial Grounding & Color Verification
- **Matrix Colors**:
- Blue (A): [0, 0] quadrant (Baseline Success, Intervention Failure)
- Orange (B): [1, 0] quadrant (Baseline Failure, Intervention Success)
- Green (C): [0, 1] quadrant (Baseline Failure, Intervention Success)
- Purple (D): [1, 1] quadrant (Baseline Success, Intervention Failure)
- **Legend Alignment**:
- No explicit legend present; colors directly embedded in matrix cells.
## Trend Verification
- **Example Data Trends**:
- Baseline failure rate (`p`): High (89%) indicates poor initial performance.
- Recovery rate (`r`): Low (12%) suggests limited intervention efficacy.
- Disruption rate (`d`): High (56%) indicates significant risk of harm.
- Threshold (`p*`): 82% balances recovery/disruption tradeoff.
## Component Isolation
1. **Header**: Title and framework purpose.
2. **Main Chart**:
- Step 1 (Pilot Study) with 2x2 matrix.
- Step 2 (Computation) with formulas and decision tree.
3. **Footer**: Worked example with numerical results and decision outcome.
## Data Table Reconstruction
| Metric | Value |
|-----------------------|-------------|
| Baseline failure rate | 89% |
| Tasks recovered (C) | 16 |
| Tasks disrupted (B) | 9 |
| Recovery rate (r) | 12% |
| Disruption rate (d) | 56% |
| Threshold (p*) | 82% |
## Notes
- No non-English text detected.
- All numerical values and formulas transcribed verbatim.
- Decision logic explicitly defined via threshold comparisons.