\n
## Diagram: Software Development/Evaluation Pipeline
### Overview
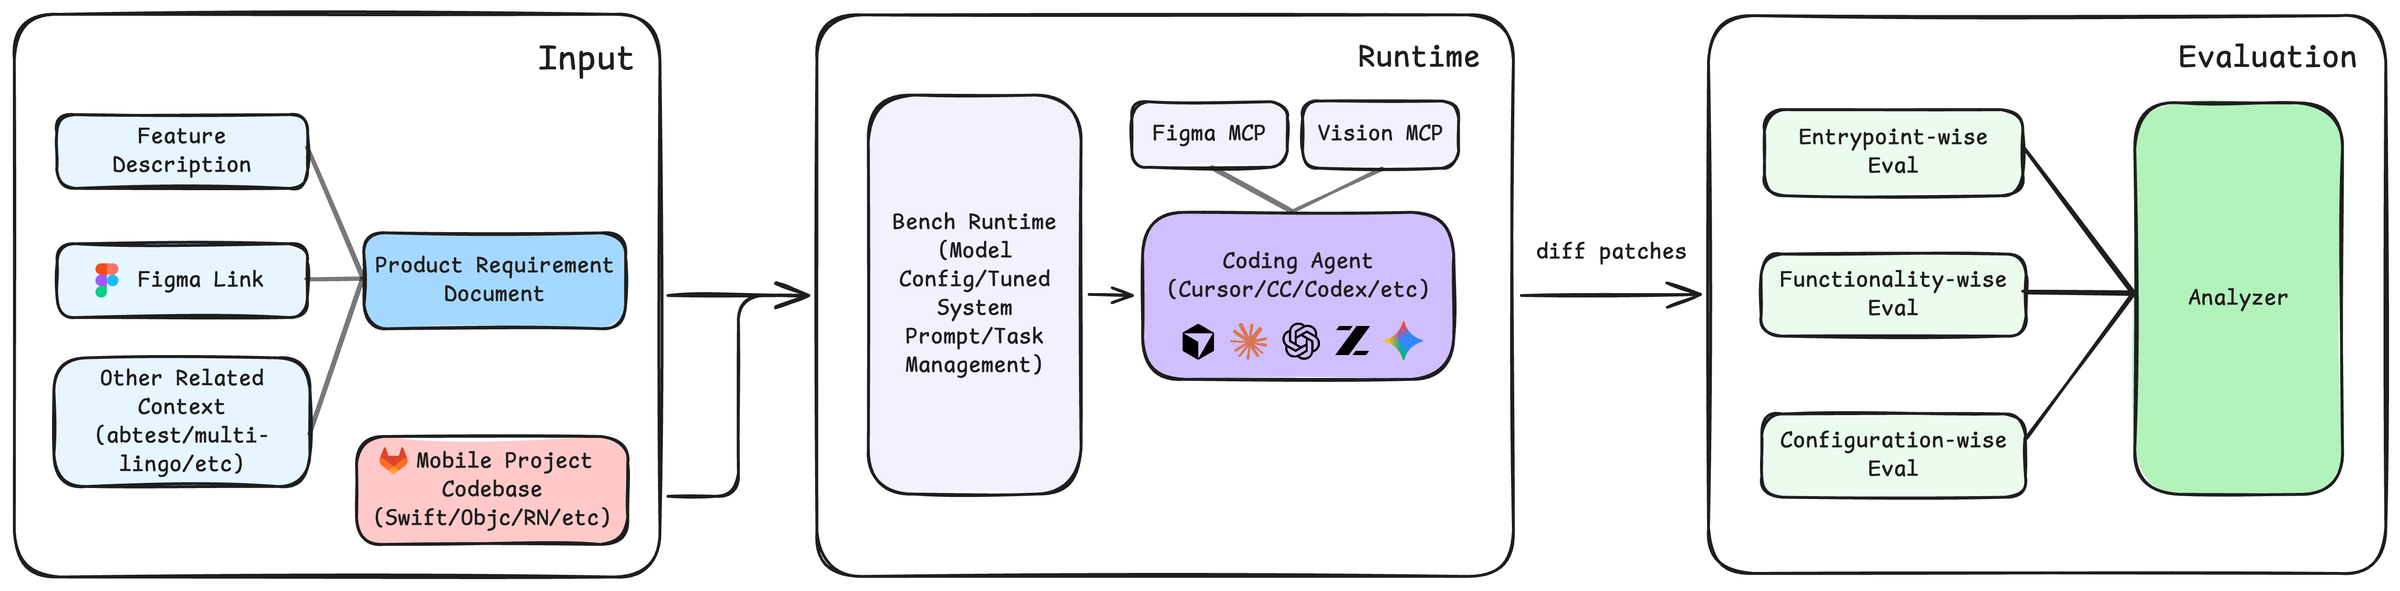
The image depicts a diagram illustrating a software development and evaluation pipeline. The pipeline is divided into three main stages: Input, Runtime, and Evaluation. Data flows from left to right through these stages, with various components and processes involved in each.
### Components/Axes
The diagram consists of rectangular boxes representing stages, rounded rectangles representing components, and arrows indicating the flow of data. The stages are labeled "Input", "Runtime", and "Evaluation". Key components within these stages include:
* **Input:**
* Feature Description
* Figma Link (with a small icon depicting a color palette)
* Product Requirement Document
* Other Related Context (abtest/multi-variant ideas)
* Mobile Project Codebase (Swift/Objc/RN/etc.) (with a small icon depicting a mobile phone)
* **Runtime:**
* Bench Runtime (Model Config/Tuned System Prompt/Task Management)
* Coding Agent (Cursor/CC/Codex/etc.) (with icons representing various coding agents)
* Figma MCP
* Vision MCP
* **Evaluation:**
* Entrypoint-wise Eval
* Functionality-wise Eval
* Configuration-wise Eval
* Analyzer
The flow between stages is indicated by arrows. A key output from the Runtime stage is "diff patches" which feeds into the Evaluation stage.
### Detailed Analysis or Content Details
The diagram shows a clear flow of information.
1. **Input Stage:** Multiple sources of information feed into this stage. These include feature descriptions, links to Figma designs, product requirements, related context (like A/B testing ideas), and the mobile project codebase.
2. **Runtime Stage:** The input is processed by a "Bench Runtime" component, which appears to involve model configuration, prompt engineering, and task management. This runtime environment then utilizes a "Coding Agent" (capable of using tools like Cursor, CC, or Codex) to generate code changes. Figma MCP and Vision MCP are also inputs to the runtime stage. The output of this stage is "diff patches" – representing the changes made to the codebase.
3. **Evaluation Stage:** The "diff patches" are then fed into the Evaluation stage, where they are assessed using three different evaluation methods: Entrypoint-wise, Functionality-wise, and Configuration-wise. An "Analyzer" component aggregates the results of these evaluations.
The diagram does not contain numerical data or specific scales. It is a conceptual representation of a process.
### Key Observations
* The diagram emphasizes the integration of design (Figma) and code generation (Coding Agent).
* The evaluation stage is multi-faceted, considering different aspects of the changes.
* The use of "MCP" (likely meaning Model Configuration Parameters) suggests a focus on model-driven development.
* The diagram highlights the importance of a well-defined input stage, encompassing various sources of information.
### Interpretation
This diagram illustrates a modern software development pipeline that leverages AI-powered coding agents and automated evaluation. The pipeline aims to streamline the process of translating product requirements and design specifications into functional code, while ensuring the quality and correctness of the changes through rigorous evaluation. The inclusion of Figma and Vision MCP suggests a focus on visual aspects and potentially computer vision-related features. The multi-faceted evaluation stage indicates a commitment to comprehensive testing and quality assurance. The diagram suggests a closed-loop system where evaluation results could potentially feed back into the input stage to refine requirements or improve the coding agent's performance. The diagram is a high-level overview and does not provide details on the specific algorithms or techniques used in each stage. It is a conceptual model rather than a detailed technical specification.