## Bar Chart: OpenAI RE Interview Multiple-Choice
### Overview
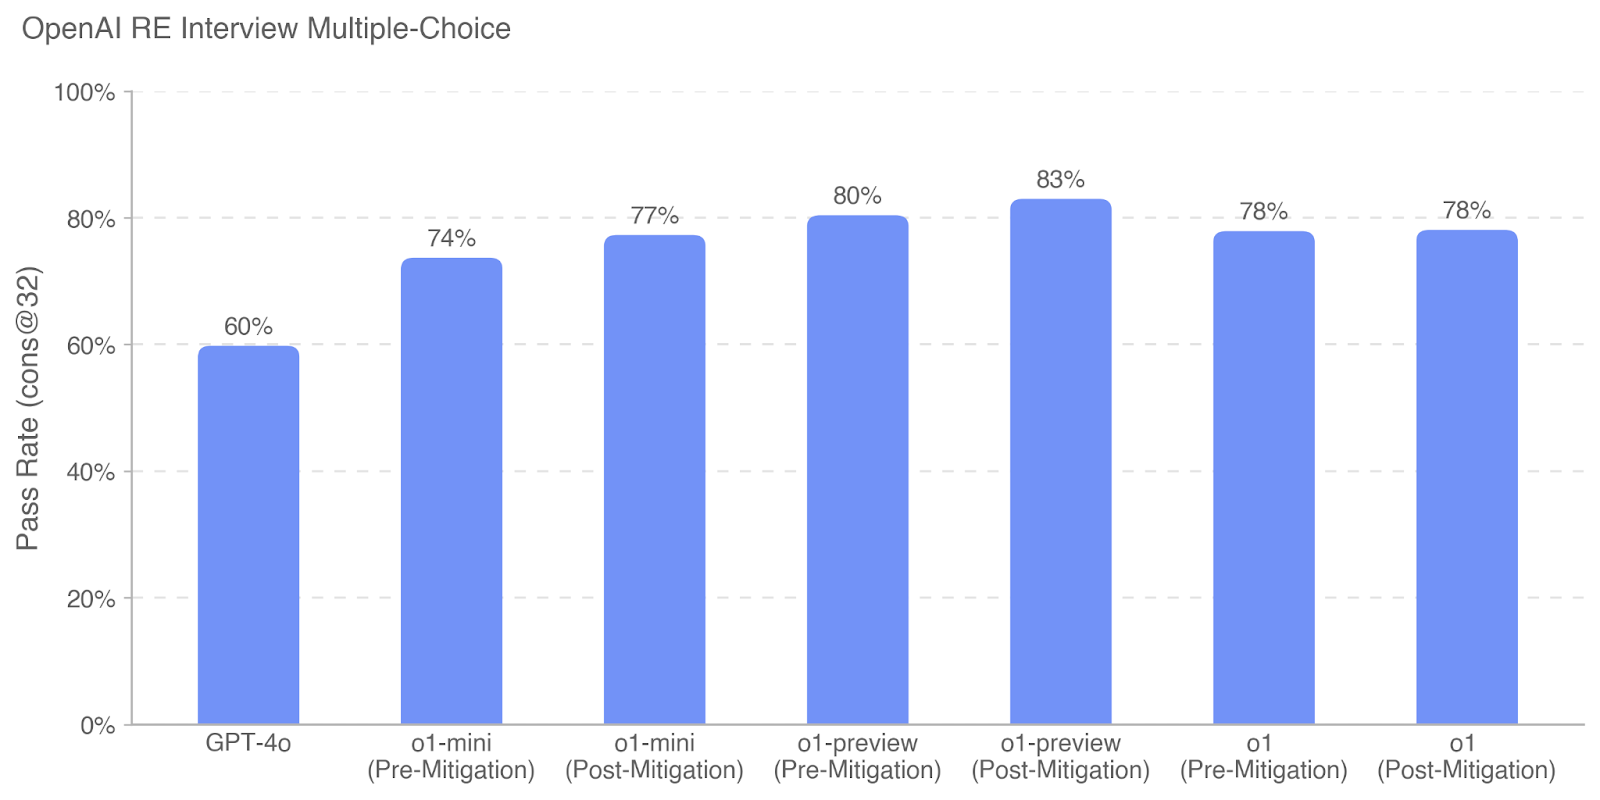
The image is a bar chart comparing the pass rates of different models (GPT-4o, o1-mini, o1-preview, and o1) on an OpenAI RE Interview Multiple-Choice test. The chart shows the pass rates before and after mitigation strategies were applied. The y-axis represents the pass rate (cons@32), ranging from 0% to 100%. The x-axis represents the different models and their pre- and post-mitigation states.
### Components/Axes
* **Title:** OpenAI RE Interview Multiple-Choice
* **Y-axis Title:** Pass Rate (cons@32)
* **Y-axis Scale:** 0%, 20%, 40%, 60%, 80%, 100%
* **X-axis Labels:**
* GPT-4o
* o1-mini (Pre-Mitigation)
* o1-mini (Post-Mitigation)
* o1-preview (Pre-Mitigation)
* o1-preview (Post-Mitigation)
* o1 (Pre-Mitigation)
* o1 (Post-Mitigation)
* **Data Series:** The chart contains one data series represented by blue bars.
### Detailed Analysis
The chart presents the pass rates for different models and mitigation strategies. All bars are a consistent light blue color.
* **GPT-4o:** The pass rate for GPT-4o is 60%.
* **o1-mini (Pre-Mitigation):** The pass rate is 74%.
* **o1-mini (Post-Mitigation):** The pass rate is 77%.
* **o1-preview (Pre-Mitigation):** The pass rate is 80%.
* **o1-preview (Post-Mitigation):** The pass rate is 83%.
* **o1 (Pre-Mitigation):** The pass rate is 78%.
* **o1 (Post-Mitigation):** The pass rate is 78%.
### Key Observations
* GPT-4o has the lowest pass rate at 60%.
* o1-preview (Post-Mitigation) has the highest pass rate at 83%.
* Mitigation strategies generally improve the pass rate, except for the 'o1' model, where the pass rate remains the same.
* The pass rate for 'o1-mini' increases from 74% to 77% after mitigation.
* The pass rate for 'o1-preview' increases from 80% to 83% after mitigation.
### Interpretation
The data suggests that mitigation strategies can improve the performance of certain models on the OpenAI RE Interview Multiple-Choice test. The 'o1-preview' model shows the most significant improvement after mitigation. The 'o1' model shows no change in pass rate after mitigation, suggesting that the mitigation strategy may not be effective for this particular model. GPT-4o has the lowest pass rate, indicating it may require further optimization or a different approach to improve its performance on this task. The chart highlights the impact of mitigation strategies on model performance and provides insights into which models benefit most from these strategies.