## Bar Chart: OpenAI RE Interview Multiple-Choice Pass Rates
### Overview
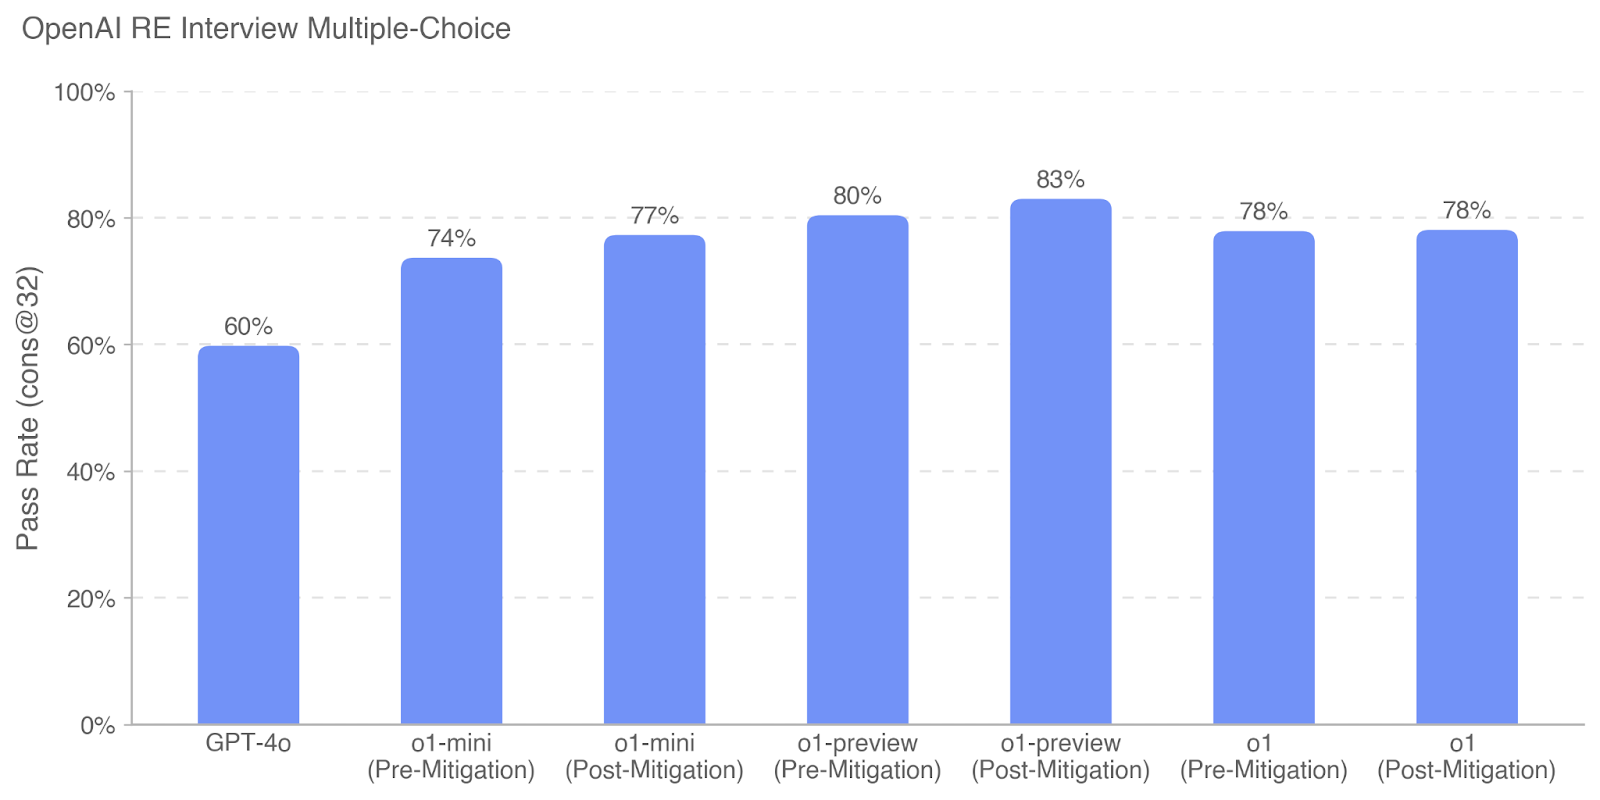
The chart compares pass rates (cons@32) for different OpenAI models across pre- and post-mitigation scenarios. It uses vertical bars to represent percentage values, with the y-axis ranging from 0% to 100% and the x-axis listing model versions and mitigation states.
### Components/Axes
- **X-axis (Categories)**:
- GPT-4o
- o1-mini (Pre-Mitigation)
- o1-mini (Post-Mitigation)
- o1-preview (Pre-Mitigation)
- o1-preview (Post-Mitigation)
- o1 (Pre-Mitigation)
- o1 (Post-Mitigation)
- **Y-axis (Values)**:
- Labeled "Pass Rate (cons@32)" with percentage increments (0%, 20%, ..., 100%)
- **Bars**:
- All bars are blue (no legend present to confirm color coding)
- Each bar has a percentage value displayed at its top (e.g., "60%", "74%")
### Detailed Analysis
- **GPT-4o**: 60% pass rate (lowest value)
- **o1-mini (Pre-Mitigation)**: 74%
- **o1-mini (Post-Mitigation)**: 77% (3% improvement)
- **o1-preview (Pre-Mitigation)**: 80%
- **o1-preview (Post-Mitigation)**: 83% (3% improvement)
- **o1 (Pre-Mitigation)**: 78%
- **o1 (Post-Mitigation)**: 78% (no change)
### Key Observations
1. **Mitigation Impact**:
- All models show improved pass rates post-mitigation except o1, which remains unchanged.
- o1-preview demonstrates the largest improvement (+3%).
2. **Model Performance**:
- o1-preview consistently outperforms other models (83% post-mitigation).
- GPT-4o has the lowest performance (60%).
3. **Consistency**:
- o1 models maintain identical pass rates pre- and post-mitigation.
### Interpretation
The data suggests that mitigation strategies significantly improve performance for most models, with o1-preview showing the most substantial gains. The lack of improvement in o1 post-mitigation may indicate either inherent robustness or insufficient mitigation adjustments. The stark contrast between GPT-4o (60%) and o1-preview (83%) highlights potential architectural or training differences between models. The absence of a legend leaves ambiguity about whether bar colors differentiate mitigation states, though the x-axis labels clarify this distinction. The consistent 78% pass rate for o1 models suggests they may already operate near optimal performance thresholds.