## Bar Chart: Prediction Flip Rate for Llama-3.2-1B & Llama-3.2-3B
### Overview
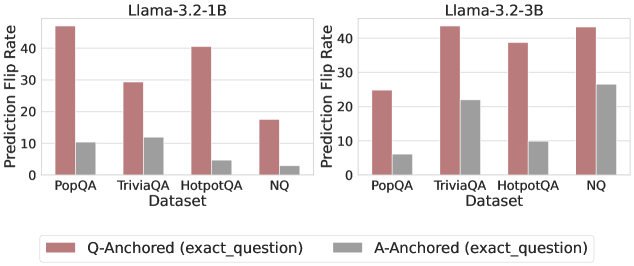
This image presents two side-by-side bar charts comparing the "Prediction Flip Rate" for two language models, Llama-3.2-1B and Llama-3.2-3B, across four datasets: PopQA, TriviaQA, HotpotQA, and NQ. The flip rate is measured on the Y-axis, while the datasets are displayed on the X-axis. Each dataset has two bars representing "Q-Anchored (exact_question)" and "A-Anchored (exact_question)".
### Components/Axes
* **Title (Left Chart):** Llama-3.2-1B
* **Title (Right Chart):** Llama-3.2-3B
* **X-axis Label:** Dataset
* **Y-axis Label:** Prediction Flip Rate
* **X-axis Markers:** PopQA, TriviaQA, HotpotQA, NQ
* **Y-axis Scale:** 0 to 40 (approximately), with increments of 10.
* **Legend:**
* Color: Light Reddish-Brown
* Label: Q-Anchored (exact\_question)
* Color: Gray
* Label: A-Anchored (exact\_question)
### Detailed Analysis
**Left Chart: Llama-3.2-1B**
* **PopQA:** The Q-Anchored bar is approximately 45, while the A-Anchored bar is approximately 8.
* **TriviaQA:** The Q-Anchored bar is approximately 30, while the A-Anchored bar is approximately 15.
* **HotpotQA:** The Q-Anchored bar is approximately 40, while the A-Anchored bar is approximately 10.
* **NQ:** The Q-Anchored bar is approximately 20, while the A-Anchored bar is approximately 5.
**Right Chart: Llama-3.2-3B**
* **PopQA:** The Q-Anchored bar is approximately 25, while the A-Anchored bar is approximately 5.
* **TriviaQA:** The Q-Anchored bar is approximately 45, while the A-Anchored bar is approximately 20.
* **HotpotQA:** The Q-Anchored bar is approximately 40, while the A-Anchored bar is approximately 10.
* **NQ:** The Q-Anchored bar is approximately 40, while the A-Anchored bar is approximately 25.
**Trends:**
* In both charts, the Q-Anchored bars are consistently higher than the A-Anchored bars across all datasets.
* For Llama-3.2-1B, the highest flip rate is observed for PopQA, followed by HotpotQA, TriviaQA, and NQ.
* For Llama-3.2-3B, the highest flip rate is observed for TriviaQA, followed by NQ, HotpotQA, and PopQA.
### Key Observations
* The Q-Anchored flip rate is significantly higher than the A-Anchored flip rate for both models across all datasets.
* Llama-3.2-1B shows a higher flip rate on PopQA and HotpotQA compared to Llama-3.2-3B.
* Llama-3.2-3B shows a higher flip rate on TriviaQA and NQ compared to Llama-3.2-1B.
### Interpretation
The data suggests that anchoring predictions based on the exact question (Q-Anchored) leads to a higher prediction flip rate compared to anchoring based on the exact answer (A-Anchored) for both Llama-3.2-1B and Llama-3.2-3B. This indicates that the models are more sensitive to changes in the question phrasing than changes in the answer phrasing.
The differences in flip rates between the two models across different datasets suggest that the models perform differently depending on the nature of the dataset. Llama-3.2-1B appears to be more robust on PopQA and HotpotQA, while Llama-3.2-3B performs better on TriviaQA and NQ. This could be due to differences in the training data or the complexity of the questions in each dataset.
The high flip rates observed in general suggest that the models are not very confident in their predictions and are easily influenced by small changes in the input. This could be a limitation of the models and an area for future improvement. The difference between Q-Anchored and A-Anchored could also indicate a bias in the model towards question-based reasoning.