## Bar Chart: Prediction Flip Rate Comparison for Llama-3.2 Models
### Overview
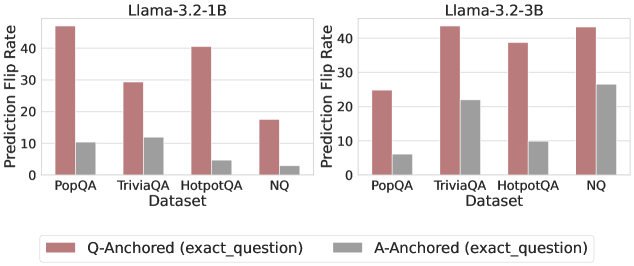
The image presents two side-by-side bar charts comparing prediction flip rates for two versions of the Llama-3.2 model (1B and 3B parameter sizes) across four question-answering datasets: PopQA, TriviaQA, HotpotQA, and NQ. Each dataset is evaluated under two anchoring methods: Q-Anchored (exact_question) and A-Anchored (exact_question), represented by red and gray bars respectively.
### Components/Axes
- **X-axis**: Datasets (PopQA, TriviaQA, HotpotQA, NQ)
- **Y-axis**: Prediction Flip Rate (0–40 scale)
- **Legend**:
- Red bars: Q-Anchored (exact_question)
- Gray bars: A-Anchored (exact_question)
- **Chart Titles**:
- Left: "Llama-3.2-1B"
- Right: "Llama-3.2-3B"
### Detailed Analysis
#### Llama-3.2-1B (Left Chart)
- **Q-Anchored (red)**:
- PopQA: ~45
- TriviaQA: ~40
- HotpotQA: ~30
- NQ: ~15
- **A-Anchored (gray)**:
- PopQA: ~10
- TriviaQA: ~12
- HotpotQA: ~5
- NQ: ~2
#### Llama-3.2-3B (Right Chart)
- **Q-Anchored (red)**:
- PopQA: ~25
- TriviaQA: ~40
- HotpotQA: ~40
- NQ: ~45
- **A-Anchored (gray)**:
- PopQA: ~5
- TriviaQA: ~22
- HotpotQA: ~10
- NQ: ~28
### Key Observations
1. **Model Size Impact**: Llama-3.2-3B consistently shows higher prediction flip rates than Llama-3.2-1B across all datasets and anchoring methods.
2. **Anchoring Method Performance**: Q-Anchored (red) outperforms A-Anchored (gray) in both models, with the largest gap observed in NQ (3B model: Q-Anchored ~45 vs A-Anchored ~28).
3. **Dataset Variability**:
- NQ dataset exhibits the highest flip rates for Q-Anchored in both models.
- A-Anchored shows its strongest performance in TriviaQA (3B model: ~22) and NQ (3B model: ~28).
4. **Trend Patterns**:
- For Llama-3.2-1B, Q-Anchored rates decrease from PopQA to NQ, while A-Anchored rates peak at TriviaQA.
- For Llama-3.2-3B, Q-Anchored rates increase from PopQA to NQ, with A-Anchored peaking at NQ.
### Interpretation
The data suggests that:
- Larger model size (3B vs 1B) correlates with higher prediction flip rates, potentially indicating greater model confidence or variability in predictions.
- Q-Anchored (exact_question) consistently demonstrates superior performance compared to A-Anchored (exact_question), suggesting that question-specific anchoring improves prediction stability.
- The NQ dataset appears to be the most challenging for both models, as evidenced by its high flip rates, particularly for Q-Anchored in the 3B model (~45).
- The A-Anchored method shows unexpected strength in the NQ dataset for the 3B model (~28), possibly indicating that answer anchoring becomes more effective for complex reasoning tasks in larger models.
This analysis highlights the importance of anchoring strategy and model scale in question-answering systems, with implications for optimizing model performance across different datasets.