## Heatmap: Classification Accuracies
### Overview
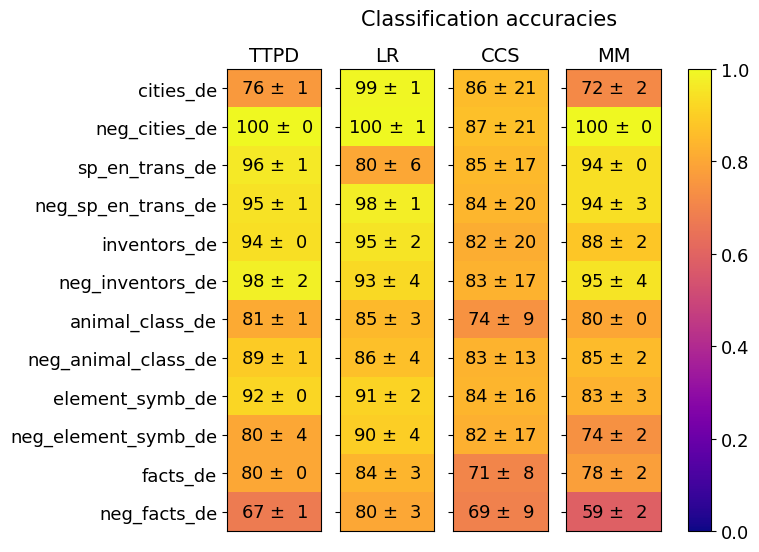
The image is a heatmap displaying classification accuracies for different categories using four different methods: TTPD, LR, CCS, and MM. The heatmap uses a color gradient from dark blue (0.0) to bright yellow (1.0) to represent the accuracy values. Each cell contains the accuracy value and its associated uncertainty (± value).
### Components/Axes
* **Title:** Classification accuracies
* **Columns (Methods):** TTPD, LR, CCS, MM
* **Rows (Categories):** cities\_de, neg\_cities\_de, sp\_en\_trans\_de, neg\_sp\_en\_trans\_de, inventors\_de, neg\_inventors\_de, animal\_class\_de, neg\_animal\_class\_de, element\_symb\_de, neg\_element\_symb\_de, facts\_de, neg\_facts\_de
* **Colorbar:** Ranges from 0.0 (dark blue) to 1.0 (bright yellow), representing the classification accuracy.
### Detailed Analysis
Here's a breakdown of the data for each category and method:
* **cities\_de:**
* TTPD: 76 ± 1
* LR: 99 ± 1
* CCS: 86 ± 21
* MM: 72 ± 2
* **neg\_cities\_de:**
* TTPD: 100 ± 0
* LR: 100 ± 1
* CCS: 87 ± 21
* MM: 100 ± 0
* **sp\_en\_trans\_de:**
* TTPD: 96 ± 1
* LR: 80 ± 6
* CCS: 85 ± 17
* MM: 94 ± 0
* **neg\_sp\_en\_trans\_de:**
* TTPD: 95 ± 1
* LR: 98 ± 1
* CCS: 84 ± 20
* MM: 94 ± 3
* **inventors\_de:**
* TTPD: 94 ± 0
* LR: 95 ± 2
* CCS: 82 ± 20
* MM: 88 ± 2
* **neg\_inventors\_de:**
* TTPD: 98 ± 2
* LR: 93 ± 4
* CCS: 83 ± 17
* MM: 95 ± 4
* **animal\_class\_de:**
* TTPD: 81 ± 1
* LR: 85 ± 3
* CCS: 74 ± 9
* MM: 80 ± 0
* **neg\_animal\_class\_de:**
* TTPD: 89 ± 1
* LR: 86 ± 4
* CCS: 83 ± 13
* MM: 85 ± 2
* **element\_symb\_de:**
* TTPD: 92 ± 0
* LR: 91 ± 2
* CCS: 84 ± 16
* MM: 83 ± 3
* **neg\_element\_symb\_de:**
* TTPD: 80 ± 4
* LR: 90 ± 4
* CCS: 82 ± 17
* MM: 74 ± 2
* **facts\_de:**
* TTPD: 80 ± 0
* LR: 84 ± 3
* CCS: 71 ± 8
* MM: 78 ± 2
* **neg\_facts\_de:**
* TTPD: 67 ± 1
* LR: 80 ± 3
* CCS: 69 ± 9
* MM: 59 ± 2
### Key Observations
* LR consistently shows high accuracy across all categories.
* CCS has the highest uncertainty (large ± values) in its accuracy measurements.
* MM performs well on "neg\_cities\_de" but relatively poorly on "cities\_de" and "neg\_facts\_de".
* TTPD has the lowest accuracy on "neg\_facts\_de" compared to other methods.
### Interpretation
The heatmap provides a comparative view of the classification accuracies of four different methods across various categories. The LR method appears to be the most reliable, showing high accuracy with relatively low uncertainty. The CCS method, while showing competitive accuracy in some categories, suffers from high uncertainty, suggesting potential instability or sensitivity to data variations. The performance differences between positive and negative categories (e.g., "cities\_de" vs. "neg\_cities\_de") may indicate biases or challenges in handling negative examples within these categories. The color gradient effectively highlights the relative performance of each method for each category, allowing for quick identification of strengths and weaknesses.