\n
## Heatmap: Classification Accuracies
### Overview
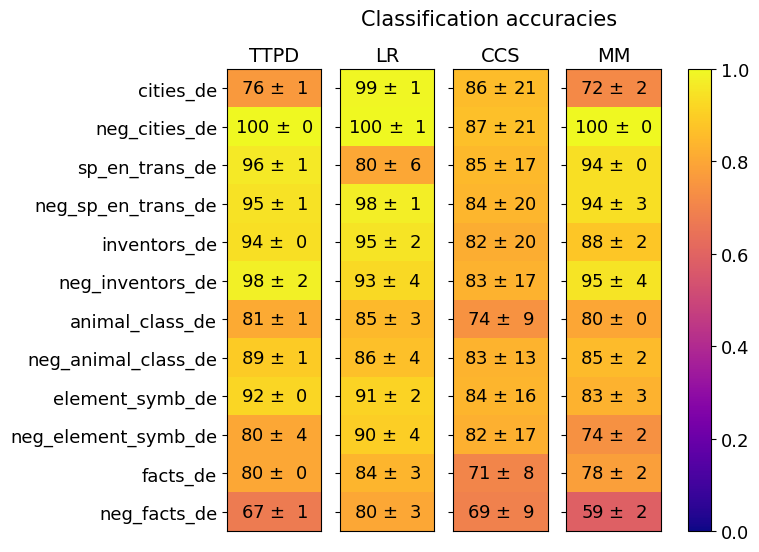
This image presents a heatmap displaying classification accuracies for various datasets using four different methods: TTPD, LR, CCS, and MM. The datasets are primarily in German ("_de") and include both positive and negative examples ("neg_"). The color scale ranges from 0.0 (purple) to 1.0 (yellow), representing accuracy levels. Each cell in the heatmap shows the accuracy value ± standard deviation.
### Components/Axes
* **Rows:** Represent the datasets:
* cities_de
* neg_cities_de
* sp_en_trans_de
* neg_sp_en_trans_de
* inventors_de
* neg_inventors_de
* animal_class_de
* neg_animal_class_de
* element_symb_de
* neg_element_symb_de
* facts_de
* neg_facts_de
* **Columns:** Represent the classification methods:
* TTPD
* LR
* CCS
* MM
* **Color Scale:** A vertical color bar on the right side of the heatmap, ranging from purple (0.0) to yellow (1.0), indicating accuracy.
* **Title:** "Classification accuracies" positioned at the top-center of the heatmap.
### Detailed Analysis
The heatmap displays accuracy values with standard deviations. Here's a breakdown of the data, row by row:
* **cities_de:**
* TTPD: 76 ± 1
* LR: 99 ± 1
* CCS: 86 ± 21
* MM: 72 ± 2
* **neg_cities_de:**
* TTPD: 100 ± 0
* LR: 100 ± 1
* CCS: 87 ± 21
* MM: 100 ± 0
* **sp_en_trans_de:**
* TTPD: 96 ± 1
* LR: 80 ± 6
* CCS: 85 ± 17
* MM: 94 ± 0
* **neg_sp_en_trans_de:**
* TTPD: 95 ± 1
* LR: 98 ± 1
* CCS: 84 ± 20
* MM: 94 ± 3
* **inventors_de:**
* TTPD: 94 ± 0
* LR: 95 ± 2
* CCS: 82 ± 20
* MM: 88 ± 2
* **neg_inventors_de:**
* TTPD: 98 ± 2
* LR: 93 ± 4
* CCS: 83 ± 17
* MM: 95 ± 4
* **animal_class_de:**
* TTPD: 81 ± 1
* LR: 85 ± 3
* CCS: 74 ± 9
* MM: 80 ± 0
* **neg_animal_class_de:**
* TTPD: 89 ± 1
* LR: 86 ± 4
* CCS: 83 ± 13
* MM: 85 ± 2
* **element_symb_de:**
* TTPD: 92 ± 0
* LR: 91 ± 2
* CCS: 84 ± 16
* MM: 83 ± 3
* **neg_element_symb_de:**
* TTPD: 80 ± 4
* LR: 90 ± 4
* CCS: 82 ± 17
* MM: 74 ± 2
* **facts_de:**
* TTPD: 80 ± 0
* LR: 84 ± 3
* CCS: 71 ± 8
* MM: 78 ± 2
* **neg_facts_de:**
* TTPD: 67 ± 1
* LR: 80 ± 3
* CCS: 69 ± 9
* MM: 59 ± 2
### Key Observations
* **LR consistently performs well:** The LR method generally achieves the highest accuracies across most datasets, often reaching 99% or 100% on the negative datasets.
* **TTPD varies significantly:** TTPD shows more variability in accuracy, ranging from 67% to 100%.
* **CCS generally has lower accuracy:** CCS consistently exhibits the lowest accuracy values compared to the other methods, with larger standard deviations.
* **Negative examples often have higher accuracy:** For several datasets (cities, sp_en_trans, inventors, element_symb), the negative examples ("neg_") demonstrate higher accuracy than their positive counterparts.
* **"facts_de" and "neg_facts_de" are the lowest performing:** Both positive and negative "facts_de" datasets have the lowest accuracy scores across all methods.
### Interpretation
The heatmap provides a comparative analysis of the performance of four classification methods on a set of German datasets. The consistently high accuracy of the LR method suggests it is well-suited for these particular tasks. The variation in TTPD's performance indicates its effectiveness may be dataset-dependent. The lower accuracy of CCS suggests it may struggle with the characteristics of these datasets.
The observation that negative examples often achieve higher accuracy could indicate that the negative examples are easier to classify, perhaps due to more distinct features or a simpler underlying structure. The poor performance on the "facts_de" datasets might suggest that factual information is more challenging to classify accurately, potentially due to ambiguity, complexity, or the need for deeper semantic understanding.
The standard deviations provide a measure of the consistency of the results. Larger standard deviations indicate greater variability in the accuracy, suggesting that the method's performance may be less reliable for those datasets. The heatmap allows for a quick visual assessment of the strengths and weaknesses of each method across different datasets, aiding in the selection of the most appropriate classification technique for a given task.