TECHNICAL ASSET FINGERPRINT
8b8a634065c352a095fa5b1d
Click to view fullscreen
Press ESC or click to close
FOUND IN PAPERS
EXPERT: healer-alpha-free VERSION 1
RUNTIME: free/openrouter/healer-alpha
INTEL_VERIFIED
## Heatmap: Classification Accuracies
### Overview
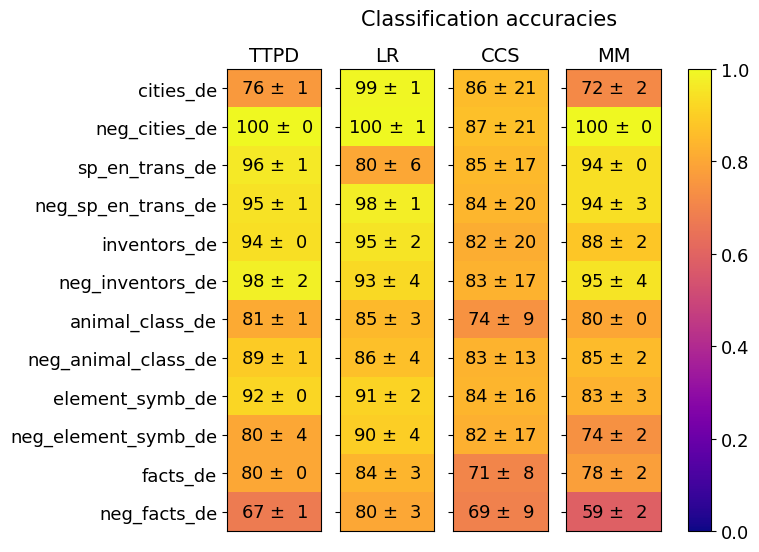
The image is a heatmap titled "Classification accuracies" that displays the performance (accuracy scores with standard deviations) of four different models or methods across twelve distinct datasets or tasks. The performance is encoded using a color gradient, with a corresponding color scale bar on the right.
### Components/Axes
* **Title:** "Classification accuracies" (top center).
* **X-axis (Columns):** Represents four models/methods. From left to right:
1. `TTPD`
2. `LR`
3. `CCS`
4. `MM`
* **Y-axis (Rows):** Represents twelve datasets or tasks. From top to bottom:
1. `cities_de`
2. `neg_cities_de`
3. `sp_en_trans_de`
4. `neg_sp_en_trans_de`
5. `inventors_de`
6. `neg_inventors_de`
7. `animal_class_de`
8. `neg_animal_class_de`
9. `element_symb_de`
10. `neg_element_symb_de`
11. `facts_de`
12. `neg_facts_de`
* **Language Note:** The suffix `_de` suggests these datasets are in German. The prefix `neg_` likely indicates a "negative" or contrast version of the base task.
* **Color Scale/Legend:** A vertical bar on the right side of the chart.
* **Range:** 0.0 (bottom, dark purple) to 1.0 (top, bright yellow).
* **Gradient:** Transitions from dark purple (0.0) through magenta, red, orange, to yellow (1.0).
* **Interpretation:** The color of each cell in the heatmap corresponds to the mean accuracy value, with yellow indicating high accuracy (~1.0) and darker colors indicating lower accuracy.
### Detailed Analysis
The following table reconstructs the data from the heatmap. Each cell contains the mean accuracy ± the standard deviation. The approximate color description is noted based on the scale.
| Dataset (Y-axis) | TTPD (Model 1) | LR (Model 2) | CCS (Model 3) | MM (Model 4) |
| :--- | :--- | :--- | :--- | :--- |
| **cities_de** | 76 ± 1 (Orange) | 99 ± 1 (Bright Yellow) | 86 ± 21 (Yellow-Orange) | 72 ± 2 (Orange) |
| **neg_cities_de** | 100 ± 0 (Bright Yellow) | 100 ± 1 (Bright Yellow) | 87 ± 21 (Yellow-Orange) | 100 ± 0 (Bright Yellow) |
| **sp_en_trans_de** | 96 ± 1 (Yellow) | 80 ± 6 (Orange) | 85 ± 17 (Yellow-Orange) | 94 ± 0 (Yellow) |
| **neg_sp_en_trans_de** | 95 ± 1 (Yellow) | 98 ± 1 (Bright Yellow) | 84 ± 20 (Yellow-Orange) | 94 ± 3 (Yellow) |
| **inventors_de** | 94 ± 0 (Yellow) | 95 ± 2 (Yellow) | 82 ± 20 (Yellow-Orange) | 88 ± 2 (Yellow-Orange) |
| **neg_inventors_de** | 98 ± 2 (Bright Yellow) | 93 ± 4 (Yellow) | 83 ± 17 (Yellow-Orange) | 95 ± 4 (Yellow) |
| **animal_class_de** | 81 ± 1 (Yellow-Orange) | 85 ± 3 (Yellow-Orange) | 74 ± 9 (Orange) | 80 ± 0 (Yellow-Orange) |
| **neg_animal_class_de** | 89 ± 1 (Yellow-Orange) | 86 ± 4 (Yellow-Orange) | 83 ± 13 (Yellow-Orange) | 85 ± 2 (Yellow-Orange) |
| **element_symb_de** | 92 ± 0 (Yellow) | 91 ± 2 (Yellow) | 84 ± 16 (Yellow-Orange) | 83 ± 3 (Yellow-Orange) |
| **neg_element_symb_de** | 80 ± 4 (Yellow-Orange) | 90 ± 4 (Yellow) | 82 ± 17 (Yellow-Orange) | 74 ± 2 (Orange) |
| **facts_de** | 80 ± 0 (Yellow-Orange) | 84 ± 3 (Yellow-Orange) | 71 ± 8 (Orange) | 78 ± 2 (Orange) |
| **neg_facts_de** | 67 ± 1 (Orange-Red) | 80 ± 3 (Yellow-Orange) | 69 ± 9 (Orange-Red) | 59 ± 2 (Red-Orange) |
### Key Observations
1. **Model Performance Variability:**
* **LR** consistently shows high performance, achieving near-perfect scores (99-100) on `cities_de`, `neg_cities_de`, and `neg_sp_en_trans_de`. Its lowest score is 80 on `sp_en_trans_de`.
* **TTPD** also performs very well, with perfect scores on `neg_cities_de` and near-perfect on `neg_inventors_de`. Its lowest score is 67 on `neg_facts_de`.
* **CCS** exhibits the highest variance in its scores (indicated by large standard deviations, e.g., ±21, ±20) and generally has the lowest mean accuracies across most datasets.
* **MM** shows mixed results, with perfect scores on `neg_cities_de` but the single lowest score in the table (59 on `neg_facts_de`).
2. **Dataset Difficulty:**
* The `neg_facts_de` dataset appears to be the most challenging, yielding the lowest scores for three out of four models (TTPD: 67, CCS: 69, MM: 59).
* The `neg_cities_de` dataset appears to be the easiest, with three models achieving 100% accuracy.
* Datasets with the `neg_` prefix do not uniformly show lower performance; in several cases (`neg_cities_de`, `neg_sp_en_trans_de`, `neg_inventors_de`), the "negative" version has equal or higher accuracy than its positive counterpart.
3. **Uncertainty (Standard Deviation):**
* The **CCS** model has notably large standard deviations (often ±15 to ±21), suggesting its performance is highly unstable or varies significantly across different runs or folds.
* The **TTPD** and **LR** models generally have very small standard deviations (±0 to ±4), indicating consistent and reliable performance.
### Interpretation
This heatmap provides a comparative analysis of four classification methods on a suite of German-language (`_de`) tasks. The data suggests the following:
* **Model Robustness:** The **LR** (likely Logistic Regression) and **TTPD** models are the most robust and accurate across this specific set of tasks. Their high scores and low variance make them reliable choices. **LR** shows a particular strength on the `cities` and `neg_sp_en_trans` tasks.
* **Task Characteristics:** The significant performance drop on `neg_facts_de` across multiple models indicates this task is inherently more difficult. This could be due to the nature of "facts" in German, the complexity of the negation, or data quality issues. Conversely, the high scores on `neg_cities_de` suggest that negating city-related information is a straightforward task for these models.
* **The "Negative" Task Paradox:** The observation that `neg_` tasks are not always harder is intriguing. It implies that for some domains (like cities), the model can easily learn the inverse relationship. For others (like facts), negation introduces significant complexity. This could be a key insight for dataset construction or understanding model reasoning.
* **Model Instability:** The **CCS** model's high variance is a major red flag. While its mean accuracy is sometimes competitive, the unreliability (e.g., 86 ± 21) makes it a risky choice for deployment without further investigation into the cause of this instability.
In summary, the heatmap reveals that **LR** is the top-performing and most consistent model overall, while the difficulty of a task is not simply determined by whether it is a "negative" formulation. The `neg_facts_de` task stands out as a critical challenge requiring further analysis.
DECODING INTELLIGENCE...