## Heatmap: Classification accuracies
### Overview
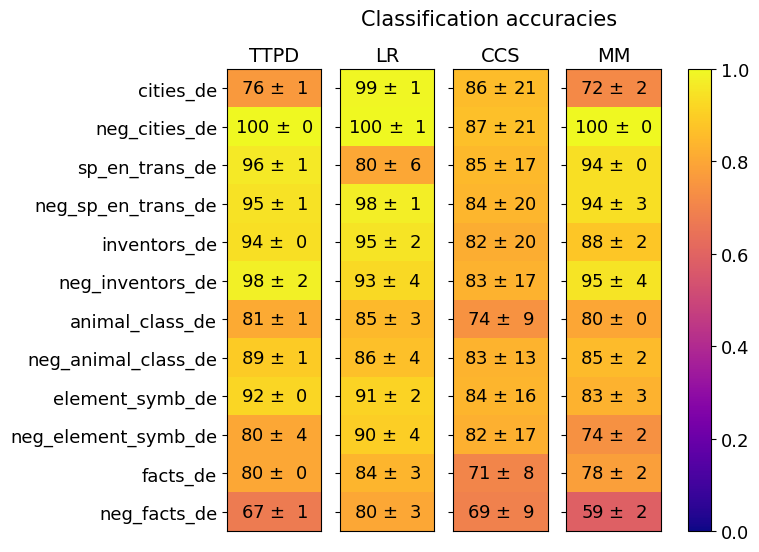
The image is a heatmap comparing classification accuracies across four methods (TTPD, LR, CCS, MM) for 12 categories. Each cell contains a percentage accuracy value with a standard deviation (e.g., "76 ± 1"). The color gradient ranges from purple (0.0) to yellow (1.0), indicating accuracy levels.
### Components/Axes
- **X-axis (Methods)**: TTPD, LR, CCS, MM (left to right)
- **Y-axis (Categories)**: 12 rows labeled:
- cities_de
- neg_cities_de
- sp_en_trans_de
- neg_sp_en_trans_de
- inventors_de
- neg_inventors_de
- animal_class_de
- neg_animal_class_de
- element_symb_de
- neg_element_symb_de
- facts_de
- neg_facts_de
- **Legend**: Vertical colorbar on the right, labeled "Classification accuracies" with a gradient from purple (0.0) to yellow (1.0).
### Detailed Analysis
#### Method Performance:
1. **TTPD**:
- Highest accuracy in `neg_cities_de` (100 ± 0).
- Lowest in `neg_facts_de` (67 ± 1).
- Average accuracy: ~85%.
2. **LR**:
- Perfect accuracy in `neg_cities_de` (100 ± 1).
- Lowest in `neg_facts_de` (80 ± 3).
- Average accuracy: ~90%.
3. **CCS**:
- Highest in `neg_cities_de` (87 ± 21).
- Lowest in `neg_facts_de` (69 ± 9).
- Average accuracy: ~82%.
4. **MM**:
- Highest in `neg_cities_de` (100 ± 0).
- Lowest in `neg_facts_de` (59 ± 2).
- Average accuracy: ~84%.
#### Category Trends:
- **Negative categories** (`neg_*`):
- TTPD and LR consistently outperform others (e.g., `neg_cities_de` at 100%).
- CCS and MM show higher variability (e.g., `neg_facts_de` at 69% and 59%).
- **Positive categories** (`*_de`):
- TTPD and LR maintain high accuracy (e.g., `cities_de` at 76% and 99%).
- CCS and MM lag slightly (e.g., `cities_de` at 86% and 72%).
### Key Observations
1. **TTPD and LR** dominate in accuracy, especially for negative categories.
2. **CCS** has the highest variability (e.g., `neg_cities_de` ±21).
3. **MM** underperforms in `neg_facts_de` (59%) but excels in `neg_cities_de` (100%).
4. **Standard deviations** are smallest for TTPD and LR, indicating more consistent performance.
### Interpretation
The data suggests that **TTPD and LR** are the most reliable methods overall, particularly for challenging negative categories. **CCS** struggles with consistency, while **MM** excels in specific cases but falters in others. The negative categories (`neg_*`) appear inherently harder, yet TTPD and LR mitigate this through higher accuracy. The standard deviations highlight that some methods (e.g., CCS) are more sensitive to data variability. This could inform method selection based on use-case requirements for precision vs. robustness.