## Heatmaps: Gauss and Laplace Distributions
### Overview
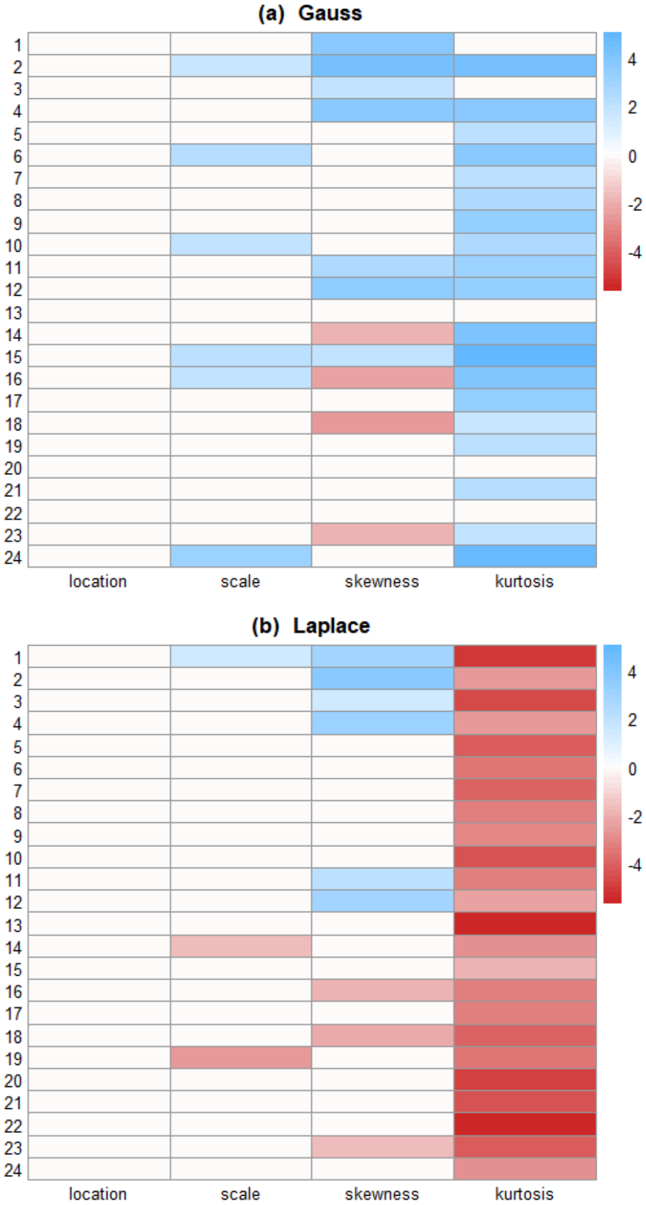
The image contains two heatmaps, one for the Gauss distribution and one for the Laplace distribution. Each heatmap visualizes the distribution's parameters (location, scale, skewness, kurtosis) across 24 different data points or observations. The color intensity represents the magnitude of the parameter value, ranging from -4 (red) to +4 (blue).
### Components/Axes
* **Titles:**
* (a) Gauss (top heatmap)
* (b) Laplace (bottom heatmap)
* **X-axis Labels:** location, scale, skewness, kurtosis
* **Y-axis Labels:** 1 to 24 (representing 24 different data points/observations)
* **Color Scale:** A vertical color bar on the right side of both heatmaps, ranging from -4 (red) to 4 (blue), with 0 (white) in the middle.
### Detailed Analysis
**Heatmap (a): Gauss**
* **Location:** All values are white, indicating a value of approximately 0 for all 24 data points.
* **Scale:** Data points 2, 6, 10, 15, 16, and 24 show a light blue color, indicating a positive value between 0 and 2. The remaining data points are white, indicating a value of approximately 0.
* **Skewness:** Data points 3, 4, 7, 8, 11, 12, 13, 15, 16, 17, 18, and 23 show a light red color, indicating a negative value between 0 and -2. The remaining data points are white, indicating a value of approximately 0.
* **Kurtosis:** Data points 2, 3, 4, 5, 6, 7, 8, 9, 10, 11, 12, 13, 14, 15, 16, 17, 18, 19, 20, 21, 22, 23, and 24 show a light blue color, indicating a positive value between 0 and 2.
**Heatmap (b): Laplace**
* **Location:** All values are white, indicating a value of approximately 0 for all 24 data points.
* **Scale:** Data points 1, 2, 3, 4, 5, 6, 7, 8, 9, 10, 11, 12, 13, 14, 15, 16, 17, 18, 19, 20, 21, 22, 23, and 24 show a light red color, indicating a negative value between 0 and -2.
* **Skewness:** Data points 1, 2, 3, 4, 5, 6, 7, 8, 9, 10, 11, 12, 13, 14, 15, 16, 17, 18, 19, 20, 21, 22, 23, and 24 show a light red color, indicating a negative value between 0 and -2.
* **Kurtosis:** Data points 1, 2, 3, 4, 5, 6, 7, 8, 9, 10, 11, 12, 13, 14, 15, 16, 17, 18, 19, 20, 21, 22, 23, and 24 show a red color, indicating a negative value between -2 and -4.
### Key Observations
* **Location:** Both Gauss and Laplace distributions have a location parameter close to 0 across all data points.
* **Scale:** The Gauss distribution shows some positive scale values for specific data points, while the Laplace distribution shows negative scale values for all data points.
* **Skewness:** The Gauss distribution shows some negative skewness values for specific data points, while the Laplace distribution shows negative skewness values for all data points.
* **Kurtosis:** The Gauss distribution shows positive kurtosis values for all data points, while the Laplace distribution shows negative kurtosis values for all data points.
### Interpretation
The heatmaps provide a visual comparison of the parameter distributions for Gauss and Laplace distributions across 24 data points. The key difference lies in the scale, skewness, and kurtosis parameters. The Gauss distribution exhibits a mix of positive and negative values for scale and skewness, while the Laplace distribution consistently shows negative values for these parameters. The kurtosis parameter is positive for Gauss and negative for Laplace, indicating differences in the tail behavior of the two distributions. The data suggests that the Laplace distribution has heavier tails and is more skewed compared to the Gauss distribution in this specific context. The location parameter being close to zero for both distributions indicates that the data is centered around zero.