## Line Graph: Accuracy vs. Attack Ratio
### Overview
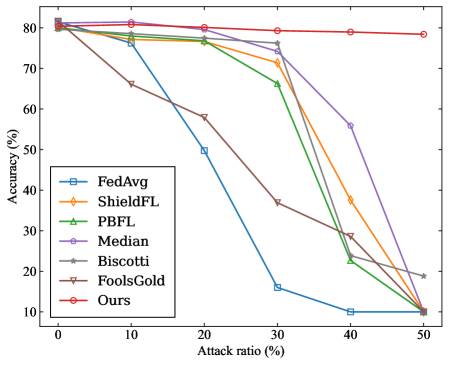
The image is a line graph comparing the accuracy of various methods (FedAvg, ShieldFL, PBFL, Median, Biscotti, FoolsGold, and "Ours") as the attack ratio increases from 0% to 50%. Accuracy is measured on the y-axis (10–80%), and attack ratio on the x-axis (0–50%). The graph highlights how each method's performance degrades under increasing adversarial pressure.
### Components/Axes
- **Y-axis**: Accuracy (%) with ticks at 10, 20, 30, 40, 50, 60, 70, 80.
- **X-axis**: Attack ratio (%) with ticks at 0, 10, 20, 30, 40, 50.
- **Legend**: Located in the bottom-left corner, mapping colors and markers to methods:
- **Blue squares**: FedAvg
- **Orange diamonds**: ShieldFL
- **Green triangles**: PBFL
- **Purple diamonds**: Median
- **Gray stars**: Biscotti
- **Brown triangles**: FoolsGold
- **Red circles**: Ours
### Detailed Analysis
1. **FedAvg (Blue squares)**:
- Starts at ~80% accuracy at 0% attack ratio.
- Drops sharply to ~75% at 10%, ~50% at 20%, ~15% at 30%, ~10% at 40%, and stabilizes at ~10% at 50%.
2. **ShieldFL (Orange diamonds)**:
- Begins at ~80% at 0%, declines to ~78% at 10%, ~75% at 20%, ~65% at 30%, ~35% at 40%, and ~10% at 50%.
3. **PBFL (Green triangles)**:
- Starts at ~80% at 0%, drops to ~77% at 10%, ~75% at 20%, ~65% at 30%, ~25% at 40%, and ~10% at 50%.
4. **Median (Purple diamonds)**:
- Remains near ~80% at 0%, declines to ~75% at 10%, ~70% at 20%, ~55% at 30%, ~55% at 40%, and ~10% at 50%.
5. **Biscotti (Gray stars)**:
- Starts at ~80% at 0%, declines to ~78% at 10%, ~75% at 20%, ~70% at 30%, ~25% at 40%, and ~10% at 50%.
6. **FoolsGold (Brown triangles)**:
- Begins at ~80% at 0%, drops to ~65% at 10%, ~55% at 20%, ~35% at 30%, ~20% at 40%, and ~10% at 50%.
7. **"Ours" (Red circles)**:
- Maintains ~80% accuracy across all attack ratios (0–50%), with minimal deviation.
### Key Observations
- **"Ours" (Red circles)** consistently outperforms all other methods, maintaining near-80% accuracy even at 50% attack ratio.
- **FedAvg (Blue squares)** and **FoolsGold (Brown triangles)** exhibit the steepest declines, dropping to ~10% accuracy by 40% attack ratio.
- **ShieldFL (Orange diamonds)** and **PBFL (Green triangles)** show moderate resilience but still degrade significantly under high attack ratios.
- **Median (Purple diamonds)** and **Biscotti (Gray stars)** perform better than FedAvg and FoolsGold but worse than "Ours."
### Interpretation
The graph demonstrates that the method labeled "Ours" is exceptionally robust against adversarial attacks, maintaining high accuracy regardless of attack ratio. This suggests it employs a more effective defense mechanism or model architecture compared to the other methods. In contrast, FedAvg and FoolsGold are highly vulnerable, indicating potential flaws in their design or training processes. ShieldFL and PBFL offer mid-tier performance, while Median and Biscotti provide moderate resilience. The stark contrast between "Ours" and other methods underscores its superiority in adversarial environments, making it a critical candidate for applications requiring high security and reliability.