## Diagram: Gene Regulatory Network with Expression Profiles
### Overview
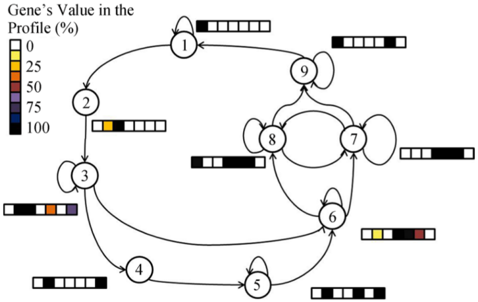
The image depicts a gene regulatory network diagram. The network consists of nine nodes, each representing a gene, interconnected by directed edges indicating regulatory relationships. Each node is associated with a bar graph representing the gene's expression profile, with colors indicating the gene's value in the profile, ranging from 0% (white) to 100% (black).
### Components/Axes
* **Nodes:** Numbered 1 through 9, representing individual genes.
* **Edges:** Directed arrows indicating regulatory relationships between genes.
* **Expression Profiles:** Bar graphs associated with each node, showing the gene's value in the profile.
* **Color Legend (Left):**
* White: 0%
* Light Yellow: 25%
* Orange: 50%
* Brown: 75%
* Dark Blue/Purple: 75%
* Black: 100%
### Detailed Analysis
Here's a breakdown of each node and its associated expression profile:
* **Node 1:** Has a self-loop. The expression profile is mostly black, indicating a high gene value (approximately 100%) across most of the profile, with a single white block.
* **Node 2:** Receives an edge from Node 1 and sends an edge to Node 3. The expression profile shows a light yellow block, followed by a black block, and then white blocks. This indicates a gene value of approximately 25% followed by 100% and then 0%.
* **Node 3:** Receives edges from Nodes 2 and 4 and has a self-loop. The expression profile shows black, light yellow, orange, and dark blue/purple blocks, followed by white blocks. This corresponds to values of approximately 100%, 25%, 50%, 75%, and 0%.
* **Node 4:** Receives an edge from Node 3 and sends an edge to Node 5. The expression profile is mostly black, indicating a high gene value (approximately 100%) across most of the profile, with a single white block.
* **Node 5:** Receives an edge from Node 4 and sends an edge to Node 6. The expression profile is mostly black, indicating a high gene value (approximately 100%) across most of the profile, with a single white block.
* **Node 6:** Receives edges from Nodes 3 and 5 and sends edges to Nodes 7 and 8. It also has a self-loop. The expression profile shows light yellow, black, and brown blocks, followed by white blocks. This corresponds to values of approximately 25%, 100%, 75%, and 0%.
* **Node 7:** Receives edges from Node 6 and sends edges to Nodes 8 and 9. It also has a self-loop. The expression profile is mostly black, indicating a high gene value (approximately 100%) across most of the profile, with a single white block.
* **Node 8:** Receives edges from Nodes 6 and 7 and sends edges to Nodes 7 and 9. The expression profile is mostly black, indicating a high gene value (approximately 100%) across most of the profile, with a single white block.
* **Node 9:** Receives edges from Nodes 7 and 8 and sends an edge to Node 1. It also has a self-loop. The expression profile is mostly black, indicating a high gene value (approximately 100%) across most of the profile, with a single white block.
### Key Observations
* Nodes 1, 3, 6, 7, 8, and 9 have self-loops, suggesting autoregulation.
* Nodes 7 and 8 form a bidirectional regulatory loop.
* Nodes 1, 4, 5, 7, 8, and 9 have expression profiles that are predominantly black, indicating high gene values.
* Nodes 2, 3, and 6 have more diverse expression profiles, suggesting more dynamic regulation.
### Interpretation
The diagram represents a gene regulatory network, where nodes represent genes and edges represent regulatory interactions. The expression profiles associated with each gene provide information about the gene's activity level under specific conditions or at different time points. The network structure and expression profiles suggest complex regulatory relationships between the genes. The presence of self-loops indicates autoregulation, while the bidirectional loop between Nodes 7 and 8 suggests a feedback mechanism. The varying expression profiles indicate that some genes are more dynamically regulated than others. The network could be used to model and understand the behavior of a biological system, such as a cell or an organism.