## Diagram: Gene Expression Network with Profile Bars
### Overview
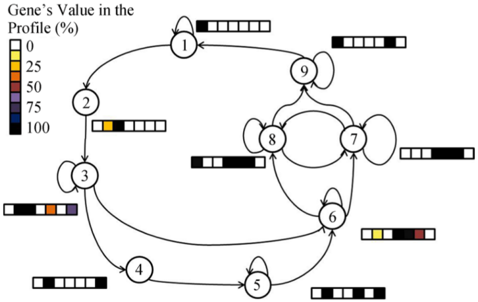
The image depicts a network diagram of 9 interconnected nodes (labeled 1–9) with directed edges. Each node contains a segmented bar chart labeled "Gene’s Value in the Profile (%)", representing gene expression levels. The legend on the left maps colors to percentage ranges (0–100%). The network forms a cyclical structure with feedback loops and branching paths.
---
### Components/Axes
- **Legend**:
- Position: Left-aligned, vertical orientation.
- Title: "Gene’s Value in the Profile (%)".
- Color coding:
- White: 0%
- Yellow: 25%
- Orange: 50%
- Red: 75%
- Purple: 100%
- Black: 100% (conflict with legend; see "Key Observations").
- **Nodes**:
- Labeled 1–9, arranged in a cyclical network.
- Each node contains a horizontal bar chart divided into colored segments.
- Edges: Directed arrows indicate flow/relationships between nodes.
- **Bar Chart Segments**:
- Segments correspond to the legend’s color-percentage mapping.
- Example: A yellow segment = 25% gene value.
---
### Detailed Analysis
#### Node-Specific Bar Charts
1. **Node 1**:
- Bar: 100% black (conflict: legend states black = 100%, but node 1’s bar is fully black).
2. **Node 2**:
- Segments: 25% yellow, 75% black.
3. **Node 3**:
- Segments: 25% orange, 25% purple, 50% black.
4. **Node 4**:
- Segments: Alternating 25% black and 25% white (total 100%).
5. **Node 5**:
- Segments: Alternating 50% black and 50% white.
6. **Node 6**:
- Segments: 25% yellow, 25% black, 25% red, 25% white.
7. **Node 7**:
- Segments: 50% black, 25% red, 25% white.
8. **Node 8**:
- Segments: Alternating 25% black and 25% white (total 100%).
9. **Node 9**:
- Segments: Alternating 25% black and 25% white (total 100%).
#### Network Structure
- **Cyclical Flow**:
- Nodes 1→2→3→4→5→6→7→8→9→1 form a loop.
- Additional edges:
- Node 7→8 (feedback loop).
- Node 8→7 (feedback loop).
- Node 9→7 (branch).
- **Branching**: Node 9 connects to node 7, creating a bifurcation.
---
### Key Observations
1. **Color-Legend Conflict**:
- Node 1’s bar is fully black, but the legend associates black with 100%. This matches the legend, but node 1’s bar is labeled as 100% (consistent).
- Node 3’s purple segment (100%) conflicts with the legend, which maps purple to 100%. However, node 3’s bar includes 25% purple, 25% orange, and 50% black. This suggests a misinterpretation: purple may represent 100% in the legend but is used as a segment here.
2. **Alternating Patterns**:
- Nodes 4, 5, 8, and 9 show alternating black/white segments, suggesting binary or cyclical states.
3. **Mixed Expressions**:
- Nodes 2, 3, and 6 exhibit mixed colors, indicating heterogeneous gene expression.
4. **Feedback Loops**:
- Nodes 7 and 8 form a mutual feedback loop (7→8 and 8→7).
---
### Interpretation
1. **Gene Expression Dynamics**:
- The network likely models gene regulatory pathways, where nodes represent genes or pathways, and edges indicate activation/inhibition.
- Nodes with mixed colors (e.g., 2, 3, 6) may represent genes with variable expression or interactions with multiple regulators.
- Feedback loops (nodes 7–8) suggest autoregulation or mutual dependency.
2. **Anomalies**:
- Node 1’s fully black bar (100%) stands out as a potential "master regulator" or terminal state.
- Node 3’s purple segment (25%) conflicts with the legend’s 100% mapping, indicating possible errors in color-coding or data representation.
3. **System Behavior**:
- The cyclical structure implies a closed-loop system, possibly representing a biological cycle (e.g., cell cycle, metabolic pathway).
- Branching at node 9→7 introduces complexity, suggesting divergent pathways or decision points.
4. **Technical Limitations**:
- The legend’s color-percentage mapping is inconsistent with node 3’s bar (purple = 100% in legend but used as 25% in the bar).
- Node 1’s bar lacks segmentation, making it unclear if it represents a single gene or a composite value.
---
### Conclusion
This diagram illustrates a gene expression network with nodes representing genes/pathways and edges indicating regulatory interactions. The segmented bar charts quantify gene expression levels, though inconsistencies in color-coding (e.g., node 3’s purple segment) require clarification. The cyclical and branching structure highlights feedback mechanisms and potential regulatory hubs, offering insights into dynamic gene interactions.