## Chart Type: Multiple Charts - Line Graphs and Bar Graph
### Overview
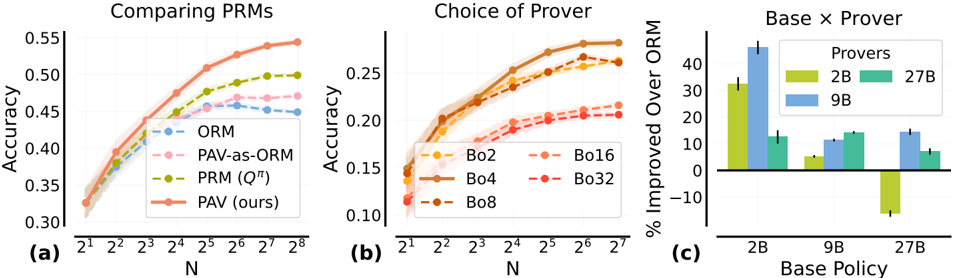
The image presents three charts comparing different Prover-Reasoner Models (PRMs). Chart (a) compares the accuracy of different PRM approaches as a function of N. Chart (b) shows the accuracy of different choices of provers as a function of N. Chart (c) shows the percentage improvement over ORM for different base policies and provers.
### Components/Axes
**Chart (a): Comparing PRMs**
* **Title:** Comparing PRMs
* **X-axis:** N (values: 2<sup>1</sup>, 2<sup>2</sup>, 2<sup>3</sup>, 2<sup>4</sup>, 2<sup>5</sup>, 2<sup>6</sup>, 2<sup>7</sup>, 2<sup>8</sup>)
* **Y-axis:** Accuracy (values range from 0.30 to 0.55, incrementing by 0.05)
* **Legend (top-right):**
* ORM (light blue, dashed line)
* PAV-as-ORM (pink, dotted line)
* PRM (Q<sup>π</sup>) (olive green, dashed line)
* PAV (ours) (salmon, solid line)
**Chart (b): Choice of Prover**
* **Title:** Choice of Prover
* **X-axis:** N (values: 2<sup>1</sup>, 2<sup>2</sup>, 2<sup>3</sup>, 2<sup>4</sup>, 2<sup>5</sup>, 2<sup>6</sup>, 2<sup>7</sup>)
* **Y-axis:** Accuracy (values range from 0.10 to 0.25, incrementing by 0.05)
* **Legend (center-right):**
* Bo2 (light orange, dashed line)
* Bo4 (light red, dashed line)
* Bo8 (brown, solid line)
* Bo16 (orange, dashed line)
* Bo32 (red, dashed line)
**Chart (c): Base x Prover**
* **Title:** Base x Prover
* **X-axis:** Base Policy (categories: 2B, 9B, 27B)
* **Y-axis:** % Improved Over ORM (values range from -10 to 40, incrementing by 10)
* **Legend (top-right):**
* 2B (olive green)
* 9B (light blue)
* 27B (teal)
### Detailed Analysis
**Chart (a): Comparing PRMs**
* **ORM (light blue, dashed line):** Accuracy increases from approximately 0.38 at N=2<sup>1</sup> to approximately 0.46 at N=2<sup>6</sup>, then plateaus.
* **PAV-as-ORM (pink, dotted line):** Accuracy increases from approximately 0.37 at N=2<sup>1</sup> to approximately 0.47 at N=2<sup>6</sup>, then plateaus.
* **PRM (Q<sup>π</sup>) (olive green, dashed line):** Accuracy increases from approximately 0.37 at N=2<sup>1</sup> to approximately 0.50 at N=2<sup>6</sup>, then plateaus.
* **PAV (ours) (salmon, solid line):** Accuracy increases from approximately 0.32 at N=2<sup>1</sup> to approximately 0.54 at N=2<sup>8</sup>.
**Chart (b): Choice of Prover**
* **Bo2 (light orange, dashed line):** Accuracy increases from approximately 0.14 at N=2<sup>1</sup> to approximately 0.18 at N=2<sup>4</sup>, then plateaus around 0.20 at N=2<sup>7</sup>.
* **Bo4 (light red, dashed line):** Accuracy increases from approximately 0.12 at N=2<sup>1</sup> to approximately 0.17 at N=2<sup>4</sup>, then plateaus around 0.21 at N=2<sup>7</sup>.
* **Bo8 (brown, solid line):** Accuracy increases from approximately 0.15 at N=2<sup>1</sup> to approximately 0.24 at N=2<sup>4</sup>, then plateaus around 0.26 at N=2<sup>7</sup>.
* **Bo16 (orange, dashed line):** Accuracy increases from approximately 0.15 at N=2<sup>1</sup> to approximately 0.25 at N=2<sup>4</sup>, then plateaus around 0.27 at N=2<sup>7</sup>.
* **Bo32 (red, dashed line):** Accuracy increases from approximately 0.11 at N=2<sup>1</sup> to approximately 0.19 at N=2<sup>4</sup>, then plateaus around 0.21 at N=2<sup>7</sup>.
**Chart (c): Base x Prover**
* **2B Base Policy:**
* 2B Prover (olive green): Approximately 32% improvement over ORM.
* 9B Prover (light blue): Approximately 42% improvement over ORM.
* 27B Prover (teal): Approximately 12% improvement over ORM.
* **9B Base Policy:**
* 2B Prover (olive green): Approximately 4% improvement over ORM.
* 9B Prover (light blue): Approximately 14% improvement over ORM.
* 27B Prover (teal): Approximately 14% improvement over ORM.
* **27B Base Policy:**
* 2B Prover (olive green): Approximately -12% improvement over ORM.
* 9B Prover (light blue): Approximately 10% improvement over ORM.
* 27B Prover (teal): Approximately 8% improvement over ORM.
### Key Observations
* In Chart (a), PAV (ours) consistently outperforms the other PRM approaches as N increases.
* In Chart (b), Bo8 and Bo16 provers generally achieve higher accuracy compared to Bo2, Bo4, and Bo32.
* In Chart (c), the 9B prover shows the highest improvement over ORM when used with the 2B base policy. The 2B prover performs poorly with the 27B base policy.
### Interpretation
The charts provide a comparative analysis of different Prover-Reasoner Models (PRMs) and the impact of prover choice on accuracy. Chart (a) highlights the superior performance of the PAV (ours) approach, suggesting its effectiveness in improving accuracy as the complexity (N) increases. Chart (b) indicates that certain provers (Bo8 and Bo16) are more effective than others, potentially due to their specific characteristics or configurations. Chart (c) reveals the interplay between base policies and provers, demonstrating that the optimal combination can significantly improve performance over the ORM baseline. The negative improvement observed with the 2B prover and 27B base policy suggests potential incompatibility or interference between these components.