## Line Graphs and Bar Chart: Comparing PRMs, Prover Choices, and Base Policy Effects
### Overview
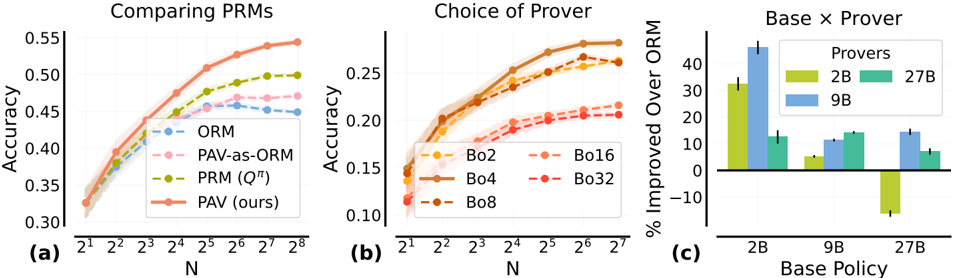
The image contains three subplots comparing performance metrics across different configurations. Subplot (a) evaluates PRM accuracy as a function of input size (N), subplot (b) analyzes prover selection accuracy, and subplot (c) measures base policy improvements over ORM. All charts use logarithmic scales for N and include error bars for uncertainty.
---
### Components/Axes
#### Subplot (a): Comparing PRMs
- **X-axis**: "N" (logarithmic scale: 2¹ to 2⁸)
- **Y-axis**: "Accuracy" (0.30 to 0.55)
- **Legend**:
- ORM (blue dashed)
- PAV-as-ORM (pink dashed)
- PRM (Qπ) (green solid)
- PAV (ours) (orange solid)
- **Spatial Grounding**: Legend in top-right corner.
#### Subplot (b): Choice of Prover
- **X-axis**: "N" (logarithmic scale: 2¹ to 2⁷)
- **Y-axis**: "Accuracy" (0.10 to 0.25)
- **Legend**:
- Bo2 (orange circles)
- Bo16 (orange squares)
- Bo4 (brown circles)
- Bo32 (red circles)
- Bo8 (brown squares)
- **Spatial Grounding**: Legend in bottom-right corner.
#### Subplot (c): Base x Prover
- **X-axis**: "Base Policy" (categories: 2B, 9B, 27B)
- **Y-axis**: "% Improved Over ORM" (-10 to 40)
- **Legend**:
- 2B (yellow)
- 9B (blue)
- 27B (green)
- **Spatial Grounding**: Legend in top-right corner.
---
### Detailed Analysis
#### Subplot (a): Comparing PRMs
- **Trend Verification**: All lines slope upward as N increases. PAV (ours) (orange) dominates, followed by PRM (Qπ) (green), PAV-as-ORM (pink), and ORM (blue).
- **Data Points**:
- At N=2⁸:
- PAV (ours): ~0.55
- PRM (Qπ): ~0.50
- PAV-as-ORM: ~0.47
- ORM: ~0.45
- At N=2¹: All lines start near 0.30–0.35.
#### Subplot (b): Choice of Prover
- **Trend Verification**: All lines slope upward. Bo4 (brown circles) and Bo8 (brown squares) outperform others.
- **Data Points**:
- At N=2⁷:
- Bo4: ~0.25
- Bo8: ~0.24
- Bo16: ~0.22
- Bo32: ~0.21
- Bo2: ~0.18
- At N=2¹: All lines start near 0.12–0.15.
#### Subplot (c): Base x Prover
- **Trend Verification**: 2B (yellow) shows the highest improvement, followed by 9B (blue) and 27B (green). 2B includes a negative outlier.
- **Data Points**:
- 2B: ~30% improvement (with a -10% outlier)
- 9B: ~15% improvement
- 27B: ~10% improvement
---
### Key Observations
1. **Subplot (a)**: PAV (ours) consistently outperforms other PRMs, with accuracy gains accelerating as N increases.
2. **Subplot (b)**: Larger Bo values (Bo4, Bo8) achieve higher accuracy, suggesting scalability benefits.
3. **Subplot (c)**: Smaller base policies (2B) yield the greatest ORM improvements, though 2B includes a notable outlier (-10%).
---
### Interpretation
- **PRM Performance**: PAV (ours) demonstrates superior accuracy across all N values, indicating its effectiveness in handling larger inputs. The gap between PAV and other PRMs widens as N grows, suggesting better scalability.
- **Prover Selection**: Bo4 and Bo8 (brown) outperform smaller Bo values, implying that larger prover configurations may better capture complex patterns. However, Bo32 (red) underperforms Bo16 (orange), hinting at potential overfitting or inefficiency at extreme scales.
- **Base Policy Impact**: Smaller base policies (2B) significantly improve ORM accuracy, but the negative outlier for 2B warrants investigation—it may reflect edge cases where the base policy conflicts with the prover’s strategy.
- **Design Implications**: The results suggest prioritizing PAV (ours) for PRM tasks and Bo4/Bo8 for prover selection. However, the 2B base policy’s outlier in subplot (c) raises questions about robustness, necessitating further validation.
This analysis underscores the importance of configuration choices in optimizing accuracy, with trade-offs between scalability, complexity, and robustness.