\n
## Diagram: Directed Graph with Node Connections
### Overview
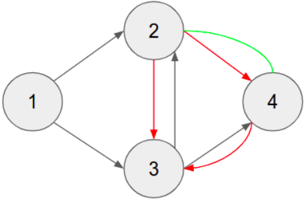
The image depicts a directed graph consisting of four nodes, numbered 1 through 4. The nodes are connected by directed edges (arrows) indicating the flow or relationship between them. The edges are colored red and green, potentially representing different types of connections or relationships.
### Components/Axes
The diagram consists of:
* **Nodes:** 1, 2, 3, and 4. Each node is represented by a circle containing its number.
* **Edges:** Directed arrows connecting the nodes.
* **Edge Colors:** Red and Green.
### Detailed Analysis or Content Details
The following connections are present in the graph:
* Node 1 -> Node 2 (Gray arrow)
* Node 1 -> Node 3 (Gray arrow)
* Node 2 -> Node 3 (Red arrow)
* Node 2 -> Node 4 (Red arrow)
* Node 3 -> Node 4 (Red arrow)
* Node 4 -> Node 2 (Green arrow)
* Node 4 -> Node 4 (Green arrow - self-loop)
### Key Observations
* Node 4 has both an outgoing edge to Node 2 and a self-loop.
* Node 2 is a source node, having only incoming edges.
* Node 1 is a source node, having only outgoing edges.
* Nodes 3 and 4 have both incoming and outgoing edges.
* The graph contains a cycle: 4 -> 2 -> 4.
### Interpretation
This diagram represents a system with directed relationships between four components (Nodes 1-4). The different colors of the edges (red and green) likely signify different types of relationships or dependencies. For example, red edges might represent a strong dependency or a critical path, while green edges could represent a feedback loop or a less critical connection. The self-loop on Node 4 suggests a self-regulating or iterative process within that component. The graph structure suggests a flow of information or control from Nodes 1 and 2 to Nodes 3 and 4, with a feedback loop from Node 4 to Node 2. Without further context, it's difficult to determine the specific meaning of the nodes and edges, but the diagram provides a visual representation of the relationships within the system.