## Directed Graph Diagram: Node Interactions and Flow Relationships
### Overview
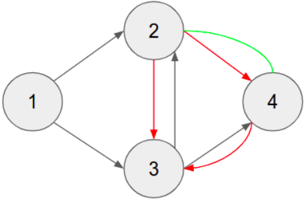
The image depicts a directed graph with four nodes (1–4) connected by colored arrows. Arrows indicate directional relationships between nodes, with three distinct arrow colors (red, green, gray) suggesting different types of interactions. No explicit legend is present, but color coding appears to differentiate relationship types.
### Components/Axes
- **Nodes**: Four labeled entities (1, 2, 3, 4) represented as gray circles with black numerals.
- **Edges**:
- **Red arrows**:
- 1 → 2 (unidirectional)
- 2 → 3 (unidirectional)
- 3 → 4 (unidirectional)
- 4 → 4 (self-loop)
- **Green arrow**:
- 2 → 4 (unidirectional)
- **Gray arrows**:
- 2 ↔ 3 (bidirectional)
- 3 ↔ 4 (bidirectional)
- **Spatial Layout**: Nodes arranged in a diamond pattern (1 top-left, 2 top-center, 3 bottom-center, 4 bottom-right). Arrows vary in curvature and thickness.
### Detailed Analysis
1. **Node 1**:
- Only outgoing edge: Red arrow to Node 2.
- No incoming connections.
2. **Node 2**:
- Incoming: Red arrow from Node 1.
- Outgoing:
- Red arrow to Node 3.
- Green arrow to Node 4.
- Bidirectional gray connection to Node 3.
3. **Node 3**:
- Incoming:
- Red arrow from Node 2.
- Gray bidirectional arrow from Node 2.
- Outgoing:
- Red arrow to Node 4.
- Gray bidirectional arrow to Node 4.
4. **Node 4**:
- Incoming:
- Green arrow from Node 2.
- Red arrow from Node 3.
- Gray bidirectional arrow from Node 3.
- Self-loop: Red arrow (4 → 4).
### Key Observations
- **Central Hub**: Node 2 acts as a primary intermediary, connecting Nodes 1, 3, and 4.
- **Feedback Loops**:
- Node 4 has a self-sustaining loop (red arrow).
- Bidirectional gray connections between Nodes 2–3 and 3–4 suggest mutual dependencies.
- **Color Coding Ambiguity**: Without a legend, red/green/gray relationships remain undefined (e.g., priority, status, or interaction type).
- **Asymmetry**: Node 1 is a source with no incoming edges, while Node 4 has the most incoming connections.
### Interpretation
This diagram likely represents a **state transition system** or **workflow process**:
- **Node 1** could represent an initial state or trigger.
- **Node 2** functions as a decision point, branching to Nodes 3 and 4.
- **Bidirectional gray arrows** between Nodes 2–3 and 3–4 imply reversible or iterative processes (e.g., validation cycles).
- The **self-loop on Node 4** suggests a terminal or recurring state (e.g., error handling, continuous operation).
- **Green arrow (2→4)** may denote a high-priority or exceptional pathway compared to red/gray connections.
### Uncertainties
- Arrow color semantics (e.g., red = error, green = success) are unspecified.
- Node labels (1–4) lack contextual meaning without additional metadata.
- Temporal or quantitative attributes (e.g., transition probabilities, time delays) are absent.
This structure could model systems like software workflows, neural networks, or organizational hierarchies, but further context is required for precise interpretation.