\n
## Diagram: Abstract Mathematical Relationship
### Overview
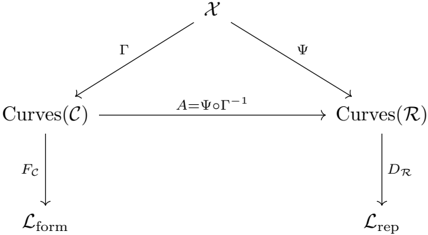
The image depicts a diagram illustrating a relationship between mathematical entities, likely within a geometric or topological context. It shows a flow of information or transformation between different sets and spaces, represented by labeled nodes and arrows. The diagram is a directed acyclic graph.
### Components/Axes
The diagram consists of the following components:
* **Nodes:** χ (Chi), Γ (Gamma), Ψ (Psi), Curves(C), Curves(R), 𝓛form, 𝓛rep
* **Arrows:**
* χ → Γ
* χ → Ψ
* Γ → Curves(C)
* Ψ → Curves(R)
* Curves(C) → 𝓛form (labeled F<sub>C</sub>)
* Curves(R) → 𝓛rep (labeled D<sub>R</sub>)
* Curves(C) ↔ Curves(R) (labeled A = ΨοΓ<sup>-1</sup>)
* **Labels:**
* Curves(C): Represents a set of curves in space C.
* Curves(R): Represents a set of curves in space R.
* 𝓛form: Likely represents a "formation" or "shape" space.
* 𝓛rep: Likely represents a "representation" space.
* A = ΨοΓ<sup>-1</sup>: Represents a transformation or mapping from Curves(C) to Curves(R), composed of the inverse of Γ and Ψ.
* F<sub>C</sub>: A mapping from Curves(C) to 𝓛form.
* D<sub>R</sub>: A mapping from Curves(R) to 𝓛rep.
### Detailed Analysis or Content Details
The diagram shows a central node χ, which branches into Γ and Ψ. Γ maps to Curves(C), and Ψ maps to Curves(R). Curves(C) and Curves(R) are connected by a bi-directional arrow labeled A = ΨοΓ<sup>-1</sup>, indicating a transformation between the two sets of curves. Curves(C) is mapped to 𝓛form by F<sub>C</sub>, and Curves(R) is mapped to 𝓛rep by D<sub>R</sub>.
The notation ΨοΓ<sup>-1</sup> suggests a function composition, where Γ<sup>-1</sup> is the inverse of the function Γ, and Ψ is applied to the result. This indicates that the transformation A involves first applying the inverse of Γ and then applying Ψ.
### Key Observations
The diagram highlights a transformation between two sets of curves (Curves(C) and Curves(R)) mediated by the functions Γ and Ψ. The mappings F<sub>C</sub> and D<sub>R</sub> suggest that the curves in each space are associated with corresponding elements in the formation and representation spaces, respectively. The bi-directional arrow between Curves(C) and Curves(R) indicates a relationship that can be traversed in both directions, although the transformation A is explicitly defined.
### Interpretation
This diagram likely represents a process of transforming curves from one space (C) to another (R) through a series of mappings. χ could represent an initial condition or parameter space. Γ and Ψ define how these parameters are used to generate curves in their respective spaces. The transformation A = ΨοΓ<sup>-1</sup> provides a way to relate curves in C to curves in R. The mappings F<sub>C</sub> and D<sub>R</sub> then associate these curves with their corresponding shapes or representations.
The diagram suggests a framework for studying the relationship between curves, their underlying parameters, and their visual or geometric properties. It could be used in areas such as computer graphics, shape analysis, or geometric modeling. The use of mathematical notation (Γ, Ψ, A, F<sub>C</sub>, D<sub>R</sub>) indicates a formal and rigorous approach to the problem. The diagram does not provide specific data or numerical values, but rather a conceptual framework for understanding the relationships between these mathematical entities.