## Bar Charts: MBPP vs. Human Eval Performance
### Overview
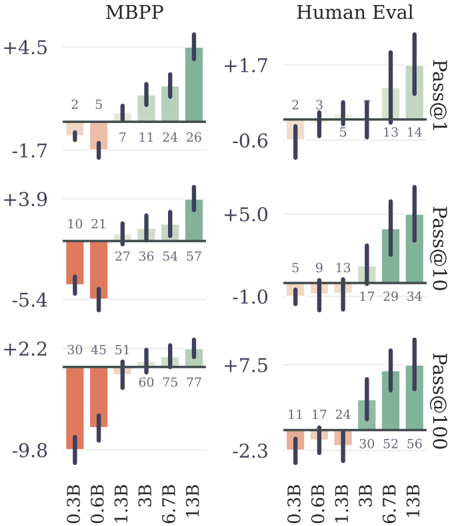
The image presents two sets of bar charts comparing the performance of a system (MBPP) against human evaluation (Human Eval) across different model sizes (0.3B to 13B). The charts display "Pass@k" values for k=1, 10, and 100, indicating the pass rate within the top k attempts. The y-axis represents the pass rate, and the x-axis represents the model size. The bars are colored differently to indicate performance relative to a baseline, with green indicating positive performance and red indicating negative performance. Error bars are included to show the uncertainty in the measurements.
### Components/Axes
* **Titles:** "MBPP" (left), "Human Eval" (right)
* **Y-Axis Labels (Left):** +4.5, -1.7, +3.9, -5.4, +2.2, -9.8
* **Y-Axis Labels (Right):** +1.7, -0.6, +5.0, -1.0, +7.5, -2.3
* **X-Axis Labels (Both):** 0.3B, 0.6B, 1.3B, 3B, 6.7B, 13B
* **Pass@k Labels (Right):** Pass@1 (top), Pass@10 (middle), Pass@100 (bottom)
* **Bar Colors:** Green (positive performance), Red (negative performance)
### Detailed Analysis
**MBPP Performance**
* **Pass@1:**
* 0.3B: Red bar, value approximately -1.0
* 0.6B: Red bar, value approximately -1.2
* 1.3B: Green bar, value approximately 0.2
* 3B: Green bar, value approximately 1.0
* 6.7B: Green bar, value approximately 2.0
* 13B: Green bar, value approximately 3.5
* Trend: Performance generally increases with model size.
* **Pass@10:**
* 0.3B: Red bar, value approximately -4.0
* 0.6B: Red bar, value approximately -4.5
* 1.3B: Green bar, value approximately 0.1
* 3B: Green bar, value approximately 1.0
* 6.7B: Green bar, value approximately 2.5
* 13B: Green bar, value approximately 3.0
* Trend: Performance generally increases with model size.
* **Pass@100:**
* 0.3B: Red bar, value approximately -8.0
* 0.6B: Red bar, value approximately -7.0
* 1.3B: Green bar, value approximately 0.5
* 3B: Green bar, value approximately 1.5
* 6.7B: Green bar, value approximately 2.0
* 13B: Green bar, value approximately 3.0
* Trend: Performance generally increases with model size.
**Human Eval Performance**
* **Pass@1:**
* 0.3B: Red bar, value approximately -0.5
* 0.6B: Red bar, value approximately -0.3
* 1.3B: Green bar, value approximately 0.3
* 3B: Green bar, value approximately 0.5
* 6.7B: Green bar, value approximately 1.2
* 13B: Green bar, value approximately 1.3
* Trend: Performance generally increases with model size.
* **Pass@10:**
* 0.3B: Red bar, value approximately -0.8
* 0.6B: Red bar, value approximately -0.7
* 1.3B: Red bar, value approximately -0.5
* 3B: Green bar, value approximately 0.3
* 6.7B: Green bar, value approximately 2.5
* 13B: Green bar, value approximately 3.5
* Trend: Performance generally increases with model size.
* **Pass@100:**
* 0.3B: Red bar, value approximately -2.0
* 0.6B: Red bar, value approximately -1.5
* 1.3B: Red bar, value approximately -1.0
* 3B: Green bar, value approximately 2.0
* 6.7B: Green bar, value approximately 5.0
* 13B: Green bar, value approximately 5.5
* Trend: Performance generally increases with model size.
### Key Observations
* Both MBPP and Human Eval show a clear trend of increasing performance (Pass@k) as the model size increases.
* Smaller models (0.3B, 0.6B, and sometimes 1.3B) tend to have negative performance (red bars), while larger models (3B, 6.7B, 13B) consistently show positive performance (green bars).
* The error bars suggest that the uncertainty in the measurements is relatively small, especially for larger models.
### Interpretation
The data suggests that increasing model size significantly improves the performance of both the MBPP system and in human evaluations. The negative performance of smaller models indicates that they may not be effective for the task being evaluated. The consistent positive performance of larger models suggests that they are better suited for the task. The similarity in trends between MBPP and Human Eval indicates that MBPP is a reasonable proxy for human evaluation. The Pass@k metric shows how the model performs when given k attempts to solve a problem. A higher Pass@k value indicates better performance.