## Bar Charts: MBPP and Human Eval Performance by Model Size
### Overview
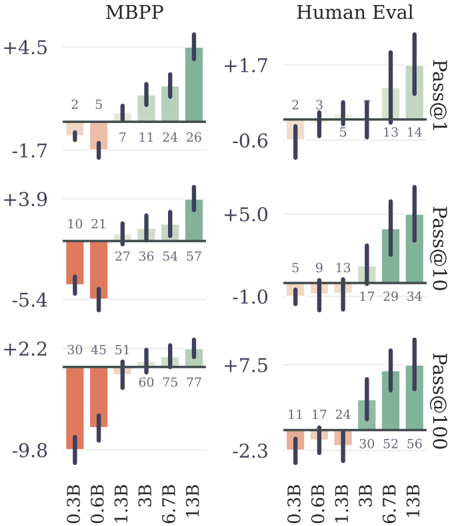
The image displays a 2x3 grid of bar charts comparing the performance of different-sized language models on two benchmarks: **MBPP** (left column) and **Human Eval** (right column). Performance is measured using the **Pass@k** metric for k=1, 10, and 100 (rows from top to bottom). Each chart plots performance against model size (0.3B to 13B parameters). The bars are colored in two distinct groups: orange/red for the two smallest models (0.3B, 0.6B) and green for the larger models (1.3B and above). Black vertical lines on each bar represent error bars or confidence intervals.
### Components/Axes
* **Charts:** Six individual bar charts arranged in two columns and three rows.
* **Column Headers:** "MBPP" (left column) and "Human Eval" (right column).
* **Row Labels (Right Side):** "Pass@1" (top row), "Pass@10" (middle row), "Pass@100" (bottom row).
* **X-Axis (Bottom of each column):** Model sizes: `0.3B`, `0.6B`, `1.3B`, `3B`, `6.7B`, `13B`.
* **Y-Axis:** Numerical scale representing the performance metric (likely percentage points or a normalized score). Each chart has its own independent scale with both positive and negative values.
* **Data Labels:** Each bar has a number printed directly above it, indicating the precise value.
* **Legend:** No explicit legend is present. The color grouping (orange for 0.3B/0.6B, green for 1.3B+) is consistent across all six charts.
### Detailed Analysis
#### **MBPP Column (Left)**
* **Pass@1 (Top-Left Chart)**
* **Y-Axis Range:** -1.7 to +4.5
* **Data Points (Model Size: Value):**
* 0.3B: 2
* 0.6B: 5
* 1.3B: 7
* 3B: 11
* 6.7B: 24
* 13B: 26
* **Trend:** Performance increases with model size. The growth is modest from 0.3B to 1.3B, then accelerates significantly from 3B to 13B.
* **Pass@10 (Middle-Left Chart)**
* **Y-Axis Range:** -5.4 to +3.9
* **Data Points (Model Size: Value):**
* 0.3B: 10
* 0.6B: 21
* 1.3B: 27
* 3B: 36
* 6.7B: 54
* 13B: 57
* **Trend:** A strong, consistent upward trend. Performance more than quintuples from the smallest to the largest model.
* **Pass@100 (Bottom-Left Chart)**
* **Y-Axis Range:** -9.8 to +2.2
* **Data Points (Model Size: Value):**
* 0.3B: 30
* 0.6B: 45
* 1.3B: 51
* 3B: 60
* 6.7B: 75
* 13B: 77
* **Trend:** Continued strong upward trend. The performance gap between 6.7B and 13B models is smaller than previous jumps, suggesting potential saturation.
#### **Human Eval Column (Right)**
* **Pass@1 (Top-Right Chart)**
* **Y-Axis Range:** -0.6 to +1.7
* **Data Points (Model Size: Value):**
* 0.3B: 2
* 0.6B: 3
* 1.3B: 5
* 3B: 13
* 6.7B: 14
* 13B: 14
* **Trend:** Performance increases with size but plateaus between 6.7B and 13B. The jump from 1.3B to 3B is the most significant.
* **Pass@10 (Middle-Right Chart)**
* **Y-Axis Range:** -1.0 to +5.0
* **Data Points (Model Size: Value):**
* 0.3B: 5
* 0.6B: 9
* 1.3B: 13
* 3B: 17
* 6.7B: 29
* 13B: 34
* **Trend:** A clear upward trend. The rate of improvement increases notably after the 3B model.
* **Pass@100 (Bottom-Right Chart)**
* **Y-Axis Range:** -2.3 to +7.5
* **Data Points (Model Size: Value):**
* 0.3B: 11
* 0.6B: 17
* 1.3B: 24
* 3B: 30
* 6.7B: 52
* 13B: 56
* **Trend:** Strong upward trend. A very large performance leap occurs between the 3B and 6.7B models.
### Key Observations
1. **Consistent Scaling Law:** Across both benchmarks and all `k` values, performance improves with increased model parameter count (from 0.3B to 13B).
2. **Benchmark Difficulty:** For any given model size and `k`, scores on **Human Eval** are consistently lower than on **MBPP**, suggesting Human Eval is the more challenging benchmark.
3. **Effect of `k`:** As `k` increases from 1 to 100, the absolute performance values increase dramatically for all models on both benchmarks, which is expected for the Pass@k metric.
4. **Performance Plateaus:** Evidence of diminishing returns appears in some series. For example, on Human Eval Pass@1, the 6.7B and 13B models have identical scores (14). On MBPP Pass@100, the gain from 6.7B (75) to 13B (77) is minimal.
5. **Color Grouping:** The consistent two-color scheme visually separates the "small" (0.3B, 0.6B) and "large" (1.3B+) model cohorts, emphasizing a performance threshold crossed around the 1B parameter mark.
### Interpretation
These charts empirically demonstrate the scaling laws of large language models on code generation tasks. The data suggests that:
* **Model size is a primary driver of capability** on standardized programming benchmarks. The relationship is not perfectly linear, with certain size transitions (e.g., 3B to 6.7B on Human Eval Pass@100) yielding outsized gains.
* **The choice of metric (`k`) drastically alters the perceived performance.** A model's ability to generate a correct solution *at least once* in 100 attempts (Pass@100) is far higher than its ability to get it right on the first try (Pass@1). This highlights the importance of considering multiple evaluation metrics.
* **Benchmark selection matters.** The consistent performance gap between MBPP and Human Eval indicates they test different aspects of coding ability or have different difficulty distributions. Researchers must consider which benchmark aligns with their target evaluation goals.
* **The observed plateaus (e.g., Human Eval Pass@1 at 6.7B/13B) are critical.** They may indicate that for certain tasks or metrics, simply adding more parameters yields diminishing returns, and architectural innovations or data quality improvements may be needed for further progress. The error bars, while not numerically specified, suggest variability in performance, which could be due to factors like random seed or evaluation set splits.