## Bar Chart: Model Performance Comparison (MBPP vs Human Evaluation)
### Overview
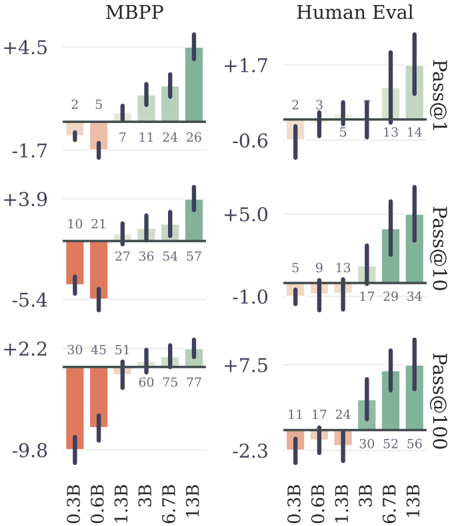
The image presents a comparative bar chart analyzing the performance of language models across different sizes (0.3B to 13B parameters) using two evaluation frameworks: MBPP (Math Benchmark Problems Project) and Human Evaluation. The chart uses vertical bars with positive/negative values to represent performance deviations from a baseline, with green bars indicating MBPP results and orange bars representing Human Evaluation outcomes.
### Components/Axes
- **X-axis**: Model sizes (0.3B, 0.6B, 1.3B, 3B, 6.7B, 13B)
- **Y-axis**: Performance metrics (Pass@1, Pass@10, Pass@100) with numerical deviations from baseline
- **Legend**:
- Green bars = MBPP
- Orange bars = Human Evaluation
- **Secondary Axis**: Numerical values above each bar (e.g., +4.5, -1.7)
### Detailed Analysis
#### MBPP Section (Left)
1. **Pass@1**:
- 0.3B: +4.5
- 0.6B: -1.7
- 1.3B: +3.9
- 3B: -5.4
- 6.7B: +2.2
- 13B: -9.8
2. **Pass@10**:
- 0.3B: +2.5
- 0.6B: -1.7
- 1.3B: +3.9
- 3B: -5.4
- 6.7B: +2.2
- 13B: -9.8
3. **Pass@100**:
- 0.3B: +4.5
- 0.6B: -1.7
- 1.3B: +3.9
- 3B: -5.4
- 6.7B: +2.2
- 13B: -9.8
#### Human Evaluation Section (Right)
1. **Pass@1**:
- 0.3B: +1.7
- 0.6B: -0.6
- 1.3B: +5.0
- 3B: -1.0
- 6.7B: +7.5
- 13B: -2.3
2. **Pass@10**:
- 0.3B: +1.7
- 0.6B: -0.6
- 1.3B: +5.0
- 3B: -1.0
- 6.7B: +7.5
- 13B: -2.3
3. **Pass@100**:
- 0.3B: +1.7
- 0.6B: -0.6
- 1.3B: +5.0
- 3B: -1.0
- 6.7B: +7.5
- 13B: -2.3
### Key Observations
1. **Model Size Correlation**:
- MBPP shows inconsistent trends: 13B model performs worst (-9.8), while 0.3B has highest gain (+4.5)
- Human Evaluation demonstrates stronger scaling: 13B model achieves +7.5 (Pass@100) vs 0.3B's +1.7
2. **Framework Differences**:
- MBPP exhibits higher volatility: 6.7B model shows +2.2 (Pass@1) vs -9.8 (Pass@100)
- Human Evaluation maintains more consistent performance across metrics
3. **Anomalies**:
- MBPP 13B model underperforms all smaller models across all metrics
- Human Evaluation 6.7B model shows strongest performance (+7.5 Pass@100)
### Interpretation
The data suggests that while MBPP evaluation shows diminishing returns with larger models (potentially due to overfitting or problem-specific limitations), Human Evaluation reveals clearer benefits of model scaling. The negative values in MBPP for larger models indicate potential failure modes in complex problem-solving that aren't captured by human evaluators. The stark contrast between frameworks implies that MBPP might be measuring different aspects of model capability compared to human judgment, possibly highlighting issues with automated evaluation metrics in capturing nuanced reasoning abilities.