## Venn Diagram: Task Error Optimization Trade-offs
### Overview
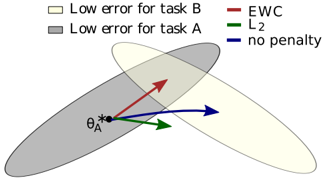
The diagram illustrates the relationship between two tasks (A and B) in terms of error minimization, using a Venn diagram with overlapping regions and directional arrows representing different optimization strategies. The intersection of the ellipses represents a critical parameter (θ_A*), while arrows indicate the direction of optimization under different constraints.
### Components/Axes
- **Legend**: Located at the top of the diagram, with three entries:
- **Red (EWC)**: Elastic Weight Consolidation
- **Green (L2)**: L2 regularization
- **Blue (no penalty)**: No regularization
- **Ellipses**:
- **Beige (Low error for task B)**: Positioned above the gray ellipse, partially overlapping.
- **Gray (Low error for task A)**: Positioned below the beige ellipse, partially overlapping.
- **Arrows**:
- **Red (EWC)**: Points toward the gray ellipse (task A).
- **Green (L2)**: Points toward the beige ellipse (task B).
- **Blue (no penalty)**: Points diagonally away from the intersection.
### Detailed Analysis
- **Ellipses**:
- The beige ellipse (task B) and gray ellipse (task A) overlap in a central region, suggesting a trade-off between minimizing errors for both tasks.
- The intersection point is labeled **θ_A***, indicating a critical parameter or configuration where both tasks are balanced.
- **Arrows**:
- **EWC (red)**: Directs optimization toward the gray ellipse (task A), prioritizing task A's error reduction.
- **L2 (green)**: Directs optimization toward the beige ellipse (task B), prioritizing task B's error reduction.
- **No penalty (blue)**: Points away from the intersection, suggesting a lack of constraint leads to suboptimal trade-offs.
### Key Observations
1. **Trade-off Visualization**: The overlapping ellipses highlight the inherent conflict between minimizing errors for task A and task B simultaneously.
2. **Directional Bias**: Each optimization strategy (EWC, L2, no penalty) biases the solution toward one task or away from the balanced region (θ_A*).
3. **Color Consistency**: Legend colors (red, green, blue) match the arrows' colors and labels, confirming alignment between strategy and direction.
### Interpretation
The diagram demonstrates how different regularization techniques (EWC, L2) or the absence of penalties influence the optimization landscape for multi-task learning. The intersection (θ_A*) represents an ideal balance, but practical strategies force a choice:
- **EWC** prioritizes task A, likely by preserving task-A-specific knowledge.
- **L2** prioritizes task B, possibly through generalized regularization.
- **No penalty** results in a direction that avoids the balanced region, indicating poor generalization or catastrophic forgetting.
This visualization underscores the importance of selecting appropriate regularization methods to maintain performance across interdependent tasks. The absence of numerical values suggests a conceptual rather than quantitative analysis, focusing on directional relationships rather than error magnitudes.