## Chart: Mean Error over Time
### Overview
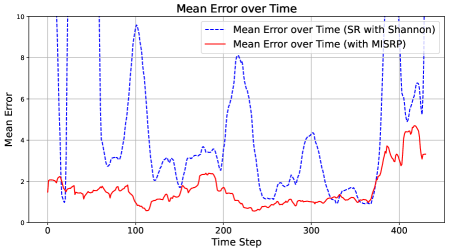
The image is a line chart comparing the mean error over time for two different methods: "SR with Shannon" and "with MISRP". The x-axis represents the time step, and the y-axis represents the mean error. The chart displays how the mean error changes over time for each method.
### Components/Axes
* **Title:** Mean Error over Time
* **X-axis:** Time Step, ranging from 0 to 400.
* **Y-axis:** Mean Error, ranging from 0 to 10.
* **Legend:** Located in the top-right corner.
* Blue dashed line: Mean Error over Time (SR with Shannon)
* Red solid line: Mean Error over Time (with MISRP)
* **Gridlines:** Present on the chart.
### Detailed Analysis
* **Mean Error over Time (SR with Shannon) - Blue Dashed Line:**
* The line starts at approximately 2 at time step 0.
* It rapidly increases to approximately 10 around time step 20.
* It decreases to approximately 3 around time step 70.
* It increases again to approximately 9 around time step 120.
* It decreases to approximately 2 around time step 200.
* It increases to approximately 4 around time step 280.
* It decreases to approximately 1.5 around time step 350.
* It increases to approximately 8 around time step 420.
* **Mean Error over Time (with MISRP) - Red Solid Line:**
* The line starts at approximately 2 at time step 0.
* It decreases to approximately 1 around time step 50.
* It increases to approximately 2.5 around time step 180.
* It decreases to approximately 1 around time step 350.
* It increases to approximately 4 around time step 420.
### Key Observations
* The "SR with Shannon" method (blue dashed line) exhibits significantly higher fluctuations in mean error compared to the "with MISRP" method (red solid line).
* The "with MISRP" method generally maintains a lower mean error than the "SR with Shannon" method, except for the very end of the time series.
* Both methods show an increase in mean error towards the end of the time period (around time step 400).
### Interpretation
The chart suggests that the "with MISRP" method is more stable and generally produces lower mean errors compared to the "SR with Shannon" method. The "SR with Shannon" method is more volatile, with large swings in mean error. The increase in error for both methods towards the end of the time period could indicate a change in the underlying data or a limitation of both methods in handling certain conditions. The "with MISRP" method appears to be more robust, maintaining a lower error for most of the time steps.