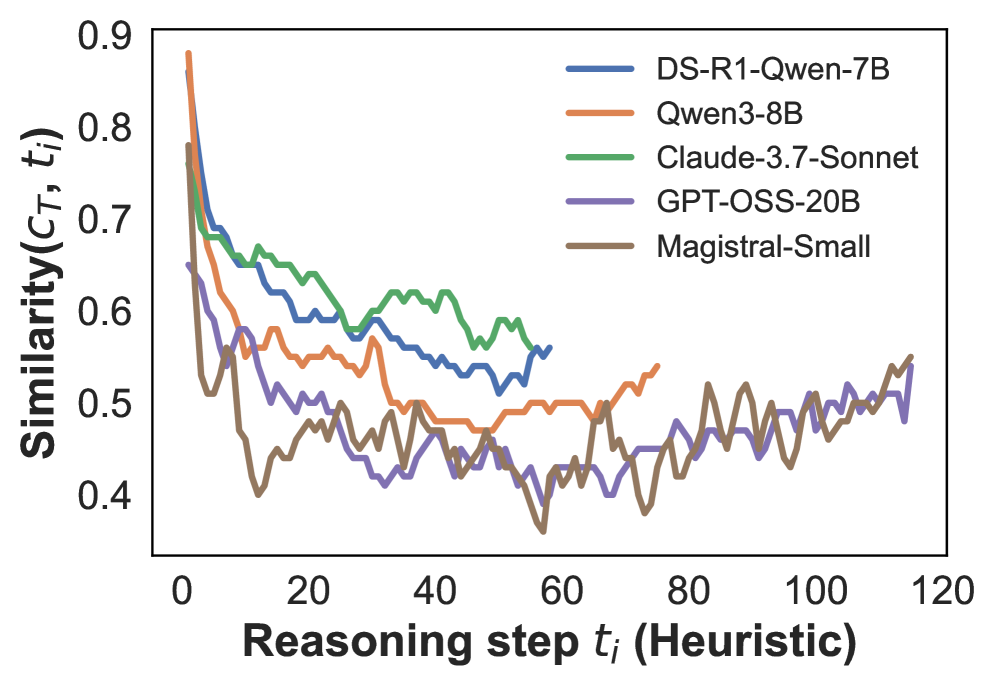
## Line Chart: Similarity vs. Reasoning Step for Five AI Models
### Overview
The image is a line chart comparing the performance of five different AI models. It plots a similarity metric against the number of heuristic reasoning steps. The chart shows that for all models, the similarity metric generally decreases as the number of reasoning steps increases, with significant fluctuations and some late-stage recovery for certain models.
### Components/Axes
* **Chart Type:** Multi-line chart.
* **X-Axis:** Labeled "Reasoning step t_i (Heuristic)". It is a linear scale ranging from 0 to 120, with major tick marks at intervals of 20 (0, 20, 40, 60, 80, 100, 120).
* **Y-Axis:** Labeled "Similarity(C_T, t_i)". It is a linear scale ranging from 0.4 to 0.9, with major tick marks at intervals of 0.1 (0.4, 0.5, 0.6, 0.7, 0.8, 0.9).
* **Legend:** Positioned in the top-right corner of the chart area. It lists five models with corresponding colored lines:
* **DS-R1-Qwen-7B** (Blue line)
* **Qwen3-8B** (Orange line)
* **Claude-3.7-Sonnet** (Green line)
* **GPT-OSS-20B** (Purple line)
* **Magistral-Small** (Brown line)
### Detailed Analysis
The analysis below describes the visual trend for each data series before listing approximate key data points. All values are approximate based on visual inspection.
1. **DS-R1-Qwen-7B (Blue Line):**
* **Trend:** Starts very high, experiences a sharp initial decline, then continues a general downward trend with moderate fluctuations. It ends before step 60.
* **Key Points:** Starts near (0, ~0.85). Drops to ~0.7 by step 5. Fluctuates between ~0.6 and ~0.7 until step 30. Declines to a low of ~0.52 around step 55 before a slight uptick to end near (58, ~0.56).
2. **Qwen3-8B (Orange Line):**
* **Trend:** Starts the highest, plummets rapidly, then fluctuates in a lower band before showing a distinct upward trend in the later steps (60-80).
* **Key Points:** Starts near (0, ~0.88). Drops sharply to ~0.6 by step 10. Fluctuates between ~0.5 and ~0.6 until step 60. Begins a clear upward trend, reaching ~0.54 by step 75.
3. **Claude-3.7-Sonnet (Green Line):**
* **Trend:** Starts moderately high, declines with notable fluctuations, maintaining a relatively higher similarity than most other models in the mid-range (steps 20-50).
* **Key Points:** Starts near (0, ~0.75). Drops to ~0.68 by step 5. Fluctuates between ~0.6 and ~0.65 until step 30. Shows a local peak of ~0.62 around step 45 before declining to end near (58, ~0.55).
4. **GPT-OSS-20B (Purple Line):**
* **Trend:** Starts lower than the first three, declines sharply, then fluctuates at a low level for the remainder of the chart, showing a slight upward trend in the final quarter.
* **Key Points:** Starts near (0, ~0.65). Drops to ~0.5 by step 10. Fluctuates primarily between ~0.4 and ~0.5 from step 20 onward. Shows a slight increase towards the end, reaching ~0.52 near step 115.
5. **Magistral-Small (Brown Line):**
* **Trend:** Starts high, experiences the most severe initial drop, and then exhibits high volatility (large up-and-down swings) throughout the rest of the chart, with a general slight upward trend in the final third.
* **Key Points:** Starts near (0, ~0.78). Plummets to a low of ~0.4 by step 15. Recovers to ~0.5 by step 25. Drops again to the chart's absolute minimum of ~0.36 around step 58. From step 60 onward, it shows high volatility but a general upward trend, ending near (115, ~0.55).
### Key Observations
* **Universal Initial Drop:** All five models show a steep decline in the similarity metric within the first 10-15 reasoning steps.
* **Divergence in Mid-Range:** After the initial drop, the models' paths diverge. Claude-3.7-Sonnet (green) and DS-R1-Qwen-7B (blue) generally maintain higher similarity values in the 20-50 step range compared to the others.
* **High Volatility:** The Magistral-Small (brown) line is the most volatile, with large, frequent swings in value.
* **Late-Stage Recovery:** Qwen3-8B (orange) and Magistral-Small (brown) show a noticeable upward trend in similarity after step 60, suggesting a potential change in behavior or convergence in later reasoning stages.
* **Data Range:** The DS-R1-Qwen-7B and Claude-3.7-Sonnet data series terminate before step 60, while the others extend to nearly step 120.
### Interpretation
This chart likely visualizes how the internal reasoning or output of different large language models (LLMs) diverges from an initial state or reference point (`C_T`) as they perform more heuristic reasoning steps (`t_i`). The "Similarity" metric quantifies this divergence.
* **What the data suggests:** The universal sharp initial drop indicates that the models' reasoning paths quickly move away from their starting point or a reference chain-of-thought. The subsequent fluctuations and different levels suggest that models have distinct "reasoning signatures" or stability profiles. Models like Claude-3.7-Sonnet and DS-R1-Qwen-7B appear to maintain more consistent reasoning (higher similarity) over a medium number of steps.
* **How elements relate:** The x-axis (reasoning steps) is the independent variable, representing computational effort or depth of thought. The y-axis (similarity) is the dependent variable, measuring consistency or faithfulness. The legend identifies the specific model architectures being compared.
* **Notable anomalies:** The late-stage upward trends for Qwen3-8B and Magistral-Small are particularly interesting. They could indicate that after a period of divergence, these models' reasoning begins to re-converge towards the reference point, or that they enter a different phase of problem-solving. The extreme volatility of Magistral-Small might imply less stable or more exploratory reasoning processes.
* **Peircean investigative reading:** The chart is an indexical sign of model behavior—it points directly to a measurable property (similarity decay). It is also a symbolic sign, requiring knowledge of AI metrics to interpret. The patterns suggest that "reasoning" in these models is not a linear, stable process but a dynamic one with phases of divergence, exploration, and potential re-convergence, varying significantly by model.