## Line Chart: Model Similarity Over Heuristic Reasoning Steps
### Overview
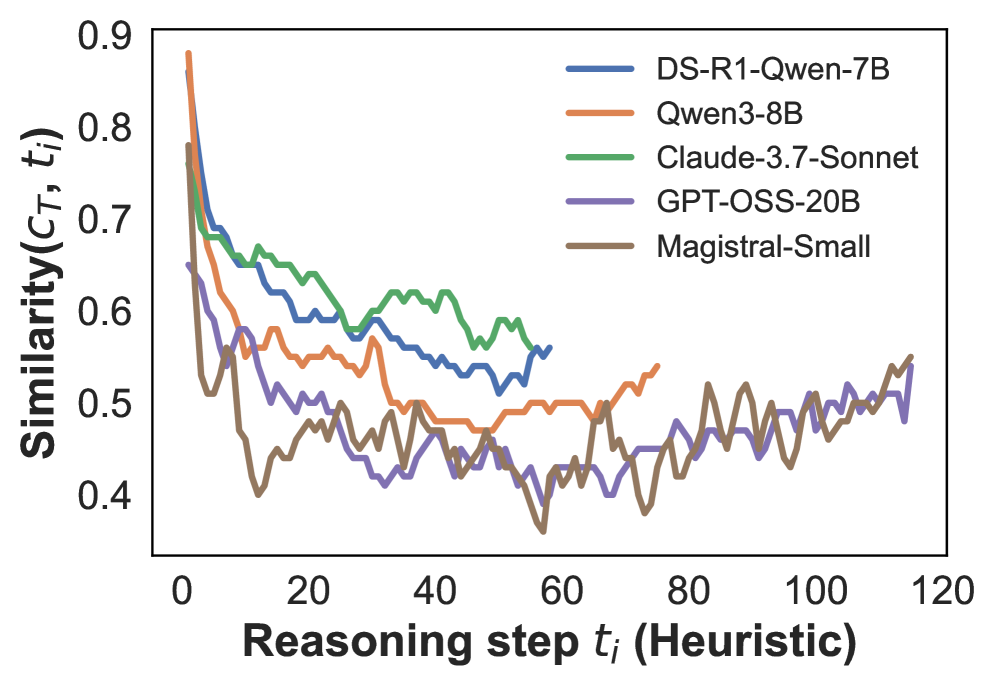
The image depicts a line chart comparing the similarity metric (c_T, t_i) of five AI models across heuristic reasoning steps (t_i). The y-axis represents similarity scores (0.4–0.9), while the x-axis spans 120 reasoning steps. Five distinct data series are plotted, each corresponding to a different model.
### Components/Axes
- **X-axis**: "Reasoning step t_i (Heuristic)" (0–120, linear scale)
- **Y-axis**: "Similarity(c_T, t_i)" (0.4–0.9, linear scale)
- **Legend**: Located in the top-right corner, mapping colors to models:
- Blue: DS-R1-Qwen-7B
- Orange: Qwen3-8B
- Green: Claude-3.7-Sonnet
- Purple: GPT-OSS-20B
- Brown: Magistral-Small
### Detailed Analysis
1. **DS-R1-Qwen-7B (Blue)**:
- Starts at ~0.85 similarity at t_i=0.
- Sharp decline to ~0.55 by t_i=60.
- Stabilizes with minor fluctuations (~0.52–0.58) afterward.
2. **Qwen3-8B (Orange)**:
- Begins at ~0.88 similarity at t_i=0.
- Rapid drop to ~0.5 by t_i=40.
- Gradual recovery to ~0.55 by t_i=120.
3. **Claude-3.7-Sonnet (Green)**:
- Initial similarity ~0.78 at t_i=0.
- Steady decline to ~0.55 by t_i=60.
- Slight uptick to ~0.58 by t_i=120.
4. **GPT-OSS-20B (Purple)**:
- Starts at ~0.65 similarity at t_i=0.
- Oscillates between ~0.45–0.55 throughout.
- No clear upward/downward trend.
5. **Magistral-Small (Brown)**:
- Begins at ~0.75 similarity at t_i=0.
- Sharp drop to ~0.4 by t_i=40.
- Recovers to ~0.55 by t_i=120 with volatility.
### Key Observations
- **Initial Decline**: All models show a steep similarity drop in the first 40 steps, suggesting diminishing performance with increasing heuristic complexity.
- **Stabilization**: Models like DS-R1-Qwen-7B and Qwen3-8B stabilize after t_i=60, while others (e.g., GPT-OSS-20B) remain volatile.
- **Recovery Patterns**: Qwen3-8B and Magistral-Small exhibit partial recovery post-t_i=60, whereas Claude-3.7-Sonnet shows minimal improvement.
- **Lowest Performance**: GPT-OSS-20B consistently underperforms, maintaining the lowest similarity scores.
### Interpretation
The data suggests that heuristic reasoning steps initially correlate with high similarity, but performance degrades as complexity increases. Models with higher initial similarity (e.g., Qwen3-8B) may overfit simpler tasks, leading to sharper declines. Partial recovery in later steps (e.g., Qwen3-8B, Magistral-Small) implies adaptive mechanisms or robustness to complexity. GPT-OSS-20B’s persistent low scores highlight potential limitations in handling heuristic reasoning. The trends underscore trade-offs between model architecture and task complexity, with no single model maintaining high similarity across all steps.