# Technical Data Extraction: Performance Heatmaps
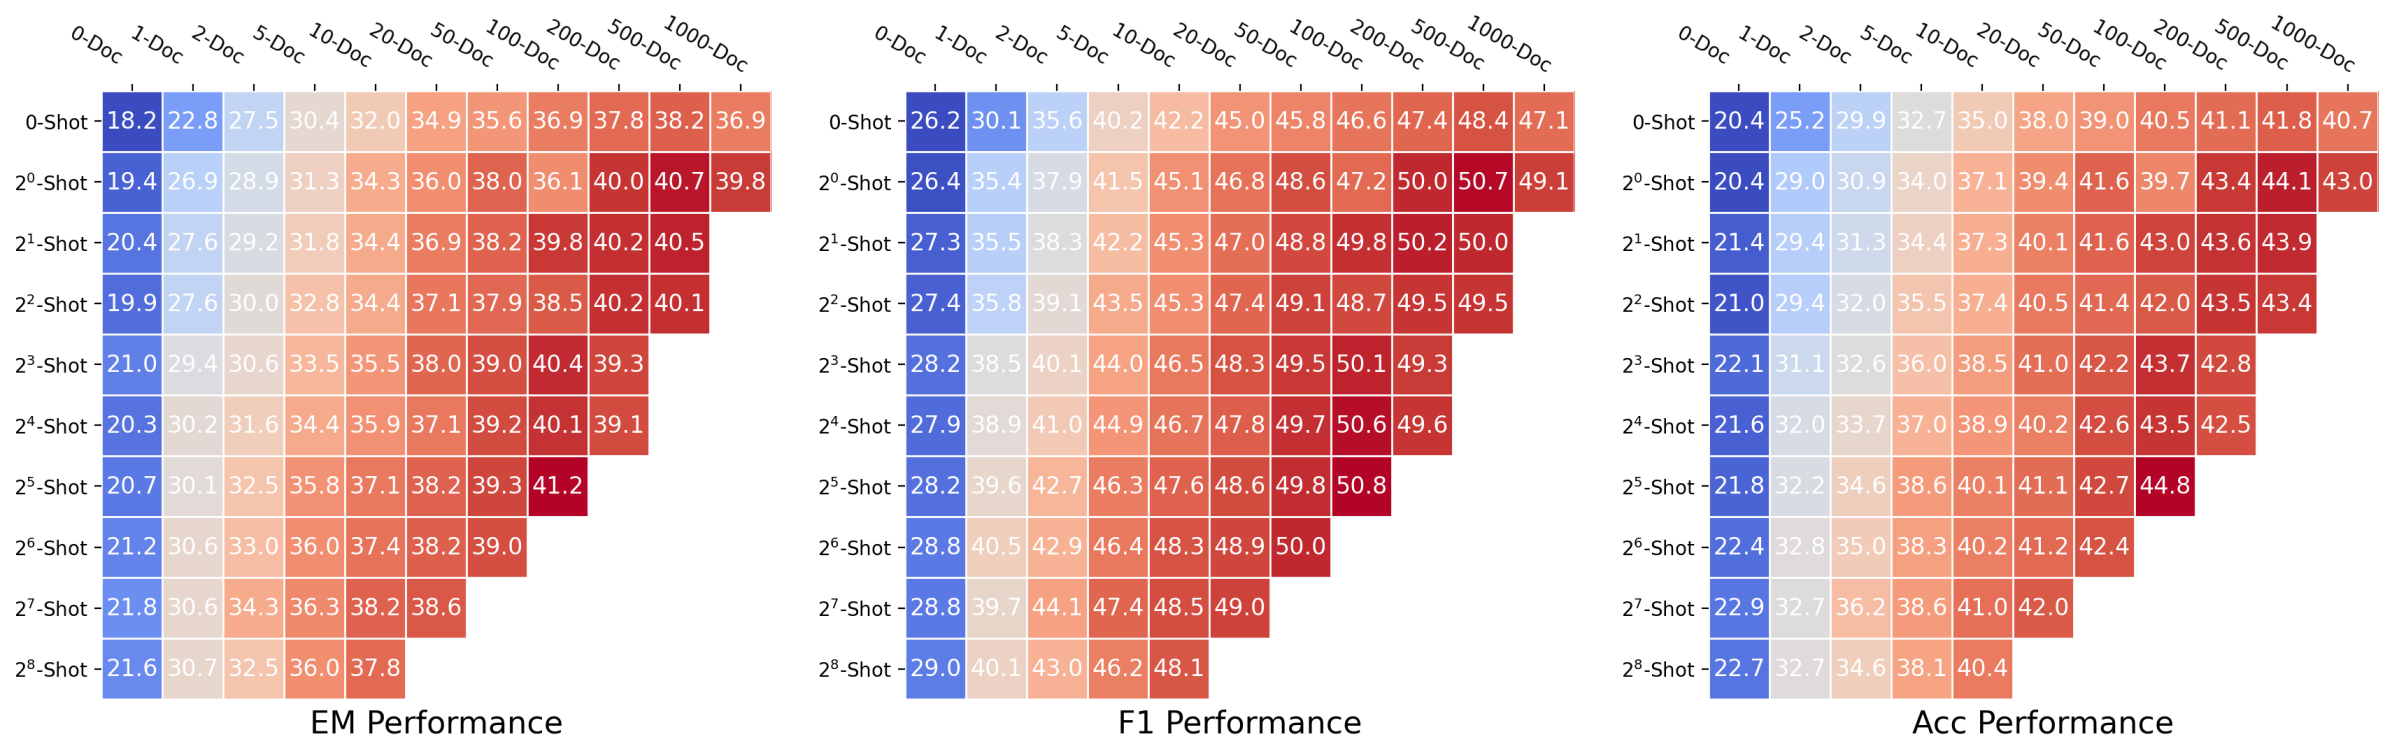
This document provides a comprehensive extraction of data from three performance heatmaps comparing model performance across two dimensions: the number of documents provided in the context (x-axis) and the number of few-shot examples provided (y-axis).
## 1. Document Overview
The image consists of three heatmaps arranged horizontally, representing different evaluation metrics:
* **Left Chart:** EM (Exact Match) Performance
* **Middle Chart:** F1 Performance
* **Right Chart:** Acc (Accuracy) Performance
### Common Axis Definitions
* **X-Axis (Top):** Number of Documents (`0-Doc`, `1-Doc`, `2-Doc`, `5-Doc`, `10-Doc`, `20-Doc`, `50-Doc`, `100-Doc`, `200-Doc`, `500-Doc`, `1000-Doc`).
* **Y-Axis (Left):** Number of Shots (`0-Shot`, $2^0$-Shot, $2^1$-Shot, $2^2$-Shot, $2^3$-Shot, $2^4$-Shot, $2^5$-Shot, $2^6$-Shot, $2^7$-Shot, $2^8$-Shot).
* **Color Gradient:** Blue (Lower performance) $\rightarrow$ White (Median) $\rightarrow$ Red (Higher performance).
---
## 2. Data Extraction: EM Performance (Left Chart)
**Trend Analysis:** Performance generally increases as both the number of documents and the number of shots increase. The highest performance is concentrated in the bottom-right of the populated area. Note that the matrix is triangular; data is not provided for high-shot/high-doc combinations in the bottom right corner.
| Shots \ Docs | 0-Doc | 1-Doc | 2-Doc | 5-Doc | 10-Doc | 20-Doc | 50-Doc | 100-Doc | 200-Doc | 500-Doc | 1000-Doc |
| :--- | :---: | :---: | :---: | :---: | :---: | :---: | :---: | :---: | :---: | :---: | :---: |
| **0-Shot** | 18.2 | 22.8 | 27.5 | 30.4 | 32.0 | 34.9 | 35.6 | 36.9 | 37.8 | 38.2 | 36.9 |
| **$2^0$-Shot** | 19.4 | 26.9 | 28.9 | 31.3 | 34.3 | 36.0 | 38.0 | 36.1 | 40.0 | 40.7 | 39.8 |
| **$2^1$-Shot** | 20.4 | 27.6 | 29.2 | 31.8 | 34.4 | 36.9 | 38.2 | 39.8 | 40.2 | 40.5 | - |
| **$2^2$-Shot** | 19.9 | 27.6 | 30.0 | 32.8 | 34.4 | 37.1 | 37.9 | 38.5 | 40.2 | 40.1 | - |
| **$2^3$-Shot** | 21.0 | 29.4 | 30.6 | 33.5 | 35.5 | 38.0 | 39.0 | 40.4 | 39.3 | - | - |
| **$2^4$-Shot** | 20.3 | 30.2 | 31.6 | 34.4 | 35.9 | 37.1 | 39.2 | 40.1 | 39.1 | - | - |
| **$2^5$-Shot** | 20.7 | 30.1 | 32.5 | 35.8 | 37.1 | 38.2 | 39.3 | 41.2 | - | - | - |
| **$2^6$-Shot** | 21.2 | 30.6 | 33.0 | 36.0 | 37.4 | 38.2 | 39.0 | - | - | - | - |
| **$2^7$-Shot** | 21.8 | 30.6 | 34.3 | 36.3 | 38.2 | 38.6 | - | - | - | - | - |
| **$2^8$-Shot** | 21.6 | 30.7 | 32.5 | 36.0 | 37.8 | - | - | - | - | - | - |
---
## 3. Data Extraction: F1 Performance (Middle Chart)
**Trend Analysis:** F1 scores are consistently higher than EM scores. The peak performance (50.8) occurs at $2^5$-Shot with 100-Doc. There is a clear "sweet spot" for performance as document count increases, with a slight drop-off at the extreme 1000-Doc edge for the 0-shot row.
| Shots \ Docs | 0-Doc | 1-Doc | 2-Doc | 5-Doc | 10-Doc | 20-Doc | 50-Doc | 100-Doc | 200-Doc | 500-Doc | 1000-Doc |
| :--- | :---: | :---: | :---: | :---: | :---: | :---: | :---: | :---: | :---: | :---: | :---: |
| **0-Shot** | 26.2 | 30.1 | 35.6 | 40.2 | 42.2 | 45.0 | 45.8 | 46.6 | 47.4 | 48.4 | 47.1 |
| **$2^0$-Shot** | 26.4 | 35.4 | 37.9 | 41.5 | 45.1 | 46.8 | 48.6 | 47.2 | 50.0 | 50.7 | 49.1 |
| **$2^1$-Shot** | 27.3 | 35.5 | 38.3 | 42.2 | 45.3 | 47.0 | 48.8 | 49.8 | 50.2 | 50.0 | - |
| **$2^2$-Shot** | 27.4 | 35.8 | 39.1 | 43.5 | 45.3 | 47.4 | 49.1 | 48.7 | 49.5 | 49.5 | - |
| **$2^3$-Shot** | 28.2 | 38.5 | 40.1 | 44.0 | 46.5 | 48.3 | 49.5 | 50.1 | 49.3 | - | - |
| **$2^4$-Shot** | 27.9 | 38.9 | 41.0 | 44.9 | 46.7 | 47.8 | 49.7 | 50.6 | 49.6 | - | - |
| **$2^5$-Shot** | 28.2 | 39.6 | 42.7 | 46.3 | 47.6 | 48.6 | 49.8 | 50.8 | - | - | - |
| **$2^6$-Shot** | 28.8 | 40.5 | 42.9 | 46.4 | 48.3 | 48.9 | 50.0 | - | - | - | - |
| **$2^7$-Shot** | 28.8 | 39.7 | 44.1 | 47.4 | 48.5 | 49.0 | - | - | - | - | - |
| **$2^8$-Shot** | 29.0 | 40.1 | 43.0 | 46.2 | 48.1 | - | - | - | - | - | - |
---
## 4. Data Extraction: Acc Performance (Right Chart)
**Trend Analysis:** Accuracy follows the same general trend as EM and F1. The highest recorded value is 44.8 at $2^5$-Shot and 100-Doc. The performance gain from 0-Doc to 1000-Doc is significant (roughly doubling the score).
| Shots \ Docs | 0-Doc | 1-Doc | 2-Doc | 5-Doc | 10-Doc | 20-Doc | 50-Doc | 100-Doc | 200-Doc | 500-Doc | 1000-Doc |
| :--- | :---: | :---: | :---: | :---: | :---: | :---: | :---: | :---: | :---: | :---: | :---: |
| **0-Shot** | 20.4 | 25.2 | 29.9 | 32.7 | 35.0 | 38.0 | 39.0 | 40.5 | 41.1 | 41.8 | 40.7 |
| **$2^0$-Shot** | 20.4 | 29.0 | 30.9 | 34.0 | 37.1 | 39.4 | 41.6 | 39.7 | 43.4 | 44.1 | 43.0 |
| **$2^1$-Shot** | 21.4 | 29.4 | 31.3 | 34.4 | 37.3 | 40.1 | 41.6 | 43.0 | 43.6 | 43.9 | - |
| **$2^2$-Shot** | 21.0 | 29.4 | 32.0 | 35.5 | 37.4 | 40.5 | 41.4 | 42.0 | 43.5 | 43.4 | - |
| **$2^3$-Shot** | 22.1 | 31.1 | 32.6 | 36.0 | 38.5 | 41.0 | 42.2 | 43.7 | 42.8 | - | - |
| **$2^4$-Shot** | 21.6 | 32.0 | 33.7 | 37.0 | 38.9 | 40.2 | 42.6 | 43.5 | 42.5 | - | - |
| **$2^5$-Shot** | 21.8 | 32.2 | 34.6 | 38.6 | 40.1 | 41.1 | 42.7 | 44.8 | - | - | - |
| **$2^6$-Shot** | 22.4 | 32.8 | 35.0 | 38.3 | 40.2 | 41.2 | 42.4 | - | - | - | - |
| **$2^7$-Shot** | 22.9 | 32.7 | 36.2 | 38.6 | 41.0 | 42.0 | - | - | - | - | - |
| **$2^8$-Shot** | 22.7 | 32.7 | 34.6 | 38.1 | 40.4 | - | - | - | - | - | - |