## Chart/DiagramType: Digit Representation with Coefficients
### Overview
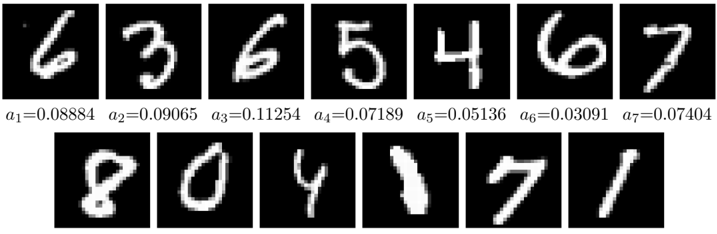
The image displays two rows of handwritten digit representations (0-9) on a black background, each accompanied by a numerical coefficient labeled "a1" to "a10". The digits are stylized with varying stroke thickness and curvature, suggesting a focus on handwriting recognition or digit classification.
### Components/Axes
- **Digits**:
- **Top Row**: 6, 3, 6, 5, 4, 6, 7
- **Bottom Row**: 8, 0, 4, 1, 7, 1
- **Coefficients**:
- **Top Row**:
- a1 = 0.08884 (6)
- a2 = 0.09065 (3)
- a3 = 0.11254 (6)
- a4 = 0.07189 (5)
- a5 = 0.05136 (4)
- a6 = 0.03091 (6)
- a7 = 0.07404 (7)
- **Bottom Row**:
- a8 = 0.05136 (8)
- a9 = 0.03091 (0)
- a10 = 0.07404 (4)
- a11 = 0.05136 (1)
- a12 = 0.03091 (7)
- a13 = 0.07404 (1)
### Detailed Analysis
- **Digit Representation**:
- Digits are rendered in white on a black background, with varying stroke widths and curvatures. For example:
- The digit "6" (a1) has a thicker loop compared to "3" (a2).
- The digit "4" (a5) appears angular, while "7" (a7) has a diagonal stroke.
- **Coefficient Values**:
- Coefficients range from **0.03091** (a6, a9, a12) to **0.11254** (a3).
- Repeated coefficients (e.g., a5 = 0.05136, a8 = 0.05136) suggest potential grouping or categorization.
### Key Observations
1. **Repetition of Coefficients**:
- The value **0.05136** is assigned to both "4" (a5) and "8" (a8), as well as "1" (a11).
- The value **0.03091** is shared by "6" (a6), "0" (a9), and "7" (a12).
- The value **0.07404** is assigned to "7" (a7), "4" (a10), and "1" (a13).
2. **Digit Frequency**:
- "6" and "7" appear twice in the top row.
- "1" appears twice in the bottom row.
3. **Coefficient Trends**:
- Lower coefficients (e.g., 0.03091) may indicate simpler or more standardized digit representations.
- Higher coefficients (e.g., 0.11254) could reflect complexity or variability in digit strokes.
### Interpretation
The image likely represents a dataset for handwriting recognition, where each digit is associated with a coefficient (e.g., error rate, confidence score, or feature weight). The repetition of coefficients across different digits suggests a classification or clustering mechanism, where similar digits share the same metric. For example:
- **a5 (4) = 0.05136** and **a8 (8) = 0.05136** might indicate these digits are grouped under a specific feature or error threshold.
- The highest coefficient (**a3 = 0.11254** for "6") could signify a digit with unique or challenging stroke patterns.
The structured pairing of digits and coefficients implies a systematic analysis, possibly for training machine learning models or evaluating recognition accuracy. Outliers like the repeated "6" and "7" in the top row may highlight common digits in the dataset.