\n
## Bar Chart: Performance Comparison of Code Generation Models
### Overview
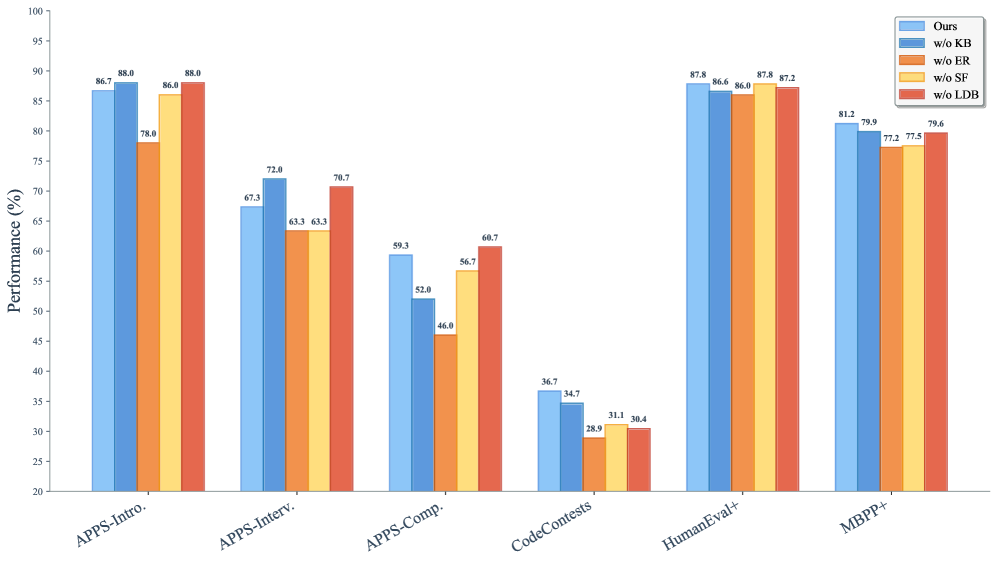
This bar chart compares the performance (in percentage) of a code generation model ("Ours") and its variants with different components removed ("w/o KB", "w/o ER", "w/o ST", "w/o LDB") across six different benchmarks: APPS-Intro, APPS-Interv, APPS-Comp, CodeContests, HumanEval+, and MBPP+. The performance is measured on the y-axis, ranging from 20% to 100%, while the x-axis represents the different benchmarks.
### Components/Axes
* **Y-axis:** "Performance (%)" - Represents the percentage of correctly generated code. Scale ranges from 20 to 100, with increments of 10.
* **X-axis:** Benchmarks: "APPS-Intro", "APPS-Interv", "APPS-Comp", "CodeContests", "HumanEval+", "MBPP+".
* **Legend (Top-Right):**
* "Ours" - Blue bars
* "w/o KB" - Light Blue bars
* "w/o ER" - Orange bars
* "w/o ST" - Red bars
* "w/o LDB" - Yellow bars
### Detailed Analysis
Here's a breakdown of the performance for each benchmark and model variant:
* **APPS-Intro:**
* "Ours": ~88.0%
* "w/o KB": ~86.7%
* "w/o ER": ~78.8%
* "w/o ST": ~67.3%
* "w/o LDB": ~63.3%
* **APPS-Interv:**
* "Ours": ~88.0%
* "w/o KB": ~86.0%
* "w/o ER": ~72.8%
* "w/o ST": ~63.3%
* "w/o LDB": ~63.3%
* **APPS-Comp:**
* "Ours": ~78.7%
* "w/o KB": ~70.7%
* "w/o ER": ~59.3%
* "w/o ST": ~52.0%
* "w/o LDB": ~46.0%
* **CodeContests:**
* "Ours": ~68.7%
* "w/o KB": ~56.7%
* "w/o ER": ~36.7%
* "w/o ST": ~34.7%
* "w/o LDB": ~28.9%
* **HumanEval+:**
* "Ours": ~87.8%
* "w/o KB": ~86.6%
* "w/o ER": ~87.2%
* "w/o ST": ~31.1%
* "w/o LDB": ~38.4%
* **MBPP+:**
* "Ours": ~81.2%
* "w/o KB": ~79.9%
* "w/o ER": ~77.5%
* "w/o ST": ~79.6%
* "w/o LDB": ~72.5%
**Trends:**
* For most benchmarks, the "Ours" model consistently outperforms all variants.
* Removing "ER" (Evidence Retrieval) and "ST" (Structure Transformer) generally leads to the most significant performance drops across all benchmarks.
* Removing "KB" (Knowledge Base) has a moderate impact on performance.
* Removing "LDB" (Long Document Builder) has the least impact on performance.
* The performance gap between "Ours" and its variants is most pronounced on "APPS-Comp" and "CodeContests".
### Key Observations
* The "Ours" model achieves the highest performance across all benchmarks.
* The "w/o ER" and "w/o ST" variants consistently exhibit the lowest performance, indicating the critical role of evidence retrieval and structure transformation in the model's success.
* The performance on "CodeContests" is significantly lower than other benchmarks, suggesting this benchmark is more challenging for the model.
* The performance of "w/o ST" on HumanEval+ is particularly low, suggesting that structure transformation is especially important for this benchmark.
### Interpretation
The data suggests that the "Ours" model, incorporating all components (KB, ER, ST, and LDB), is the most effective code generation model among those tested. The substantial performance drops observed when removing "ER" and "ST" highlight their importance in the model's ability to understand and generate correct code. The relatively smaller impact of removing "KB" and "LDB" suggests that while these components contribute to performance, they are less critical than evidence retrieval and structure transformation.
The lower performance on "CodeContests" could indicate that this benchmark requires a different set of skills or knowledge compared to the other benchmarks. The benchmark may involve more complex problem-solving or require access to a broader range of information.
The chart provides a clear quantitative comparison of the different model variants, allowing for a data-driven assessment of the contribution of each component to the overall performance. This information can be used to guide future research and development efforts aimed at improving the performance of code generation models. The consistent trend across benchmarks reinforces the validity of the findings.