## Grouped Bar Chart: Performance Comparison of Ablated Methods Across Code Generation Benchmarks
### Overview
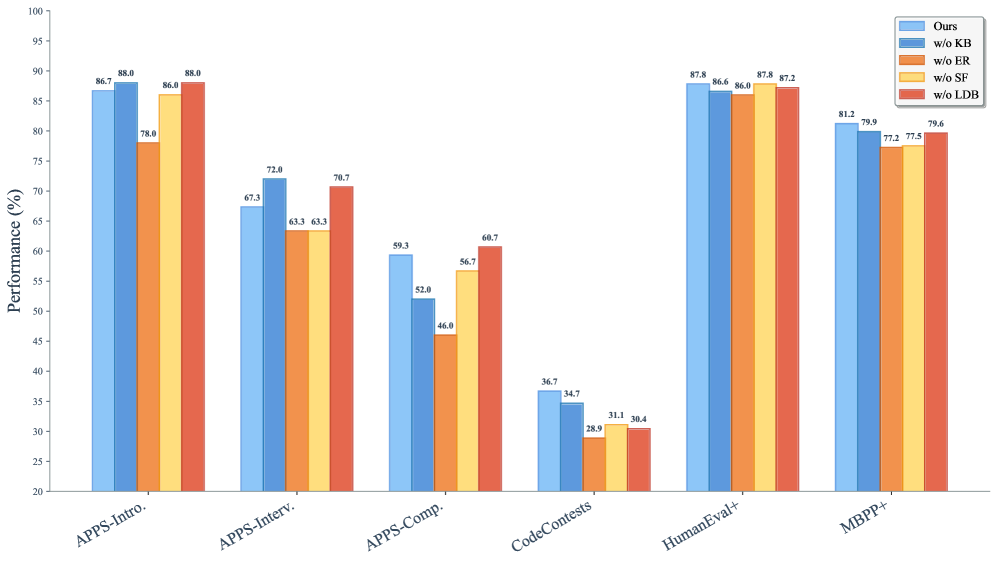
The image displays a grouped bar chart comparing the performance (in percentage) of a proposed method ("Ours") against four ablated variants across six different code generation benchmarks. The chart evaluates the contribution of different components (KB, ER, SF, LDB) by showing performance when each is removed.
### Components/Axes
* **Y-Axis:** Labeled "Performance (%)". Scale ranges from 20 to 100, with major tick marks every 5 units.
* **X-Axis:** Lists six benchmark categories:
1. APPS-Intro.
2. APPS-Interv.
3. APPS-Comp.
4. CodeContests
5. HumanEval+
6. MBPP+
* **Legend:** Positioned in the top-right corner. It defines five data series by color:
* **Ours** (Light Blue)
* **w/o KB** (Medium Blue)
* **w/o ER** (Orange)
* **w/o SF** (Yellow)
* **w/o LDB** (Red)
* **Data Labels:** Each bar has its exact performance value printed above it.
### Detailed Analysis
Performance values for each method across all benchmarks are as follows:
| Benchmark | Ours | w/o KB | w/o ER | w/o SF | w/o LDB | Trend |
|----------------|--------|--------|--------|--------|---------|-------------------------------------------------------------------------------------------------------|
| APPS-Intro. | 86.7% | 88.0% | 78.0% | 86.0% | 88.0% | High performance overall. The "w/o ER" variant shows a notable drop. |
| APPS-Interv. | 67.3% | 72.0% | 63.3% | 63.3% | 70.7% | Moderate performance. "w/o KB" achieves the highest score, while "w/o ER" and "w/o SF" are tied for the lowest. |
| APPS-Comp. | 59.3% | 52.0% | 46.0% | 56.7% | 60.7% | Lower performance tier. "w/o LDB" slightly outperforms "Ours". "w/o ER" is the lowest. |
| CodeContests | 36.7% | 34.7% | 28.9% | 31.1% | 30.4% | The lowest performance across all benchmarks. "Ours" leads, but all scores are below 37%. |
| HumanEval+ | 87.8% | 86.6% | 86.0% | 87.8% | 87.2% | Very high and tightly clustered performance. "Ours" and "w/o SF" are tied for the highest. |
| MBPP+ | 81.2% | 79.9% | 77.2% | 77.5% | 79.6% | High performance. "Ours" leads, with other variants trailing by 1-4 percentage points. |
### Key Observations
1. **Benchmark Difficulty:** Performance varies drastically by benchmark. APPS-Intro. and HumanEval+ yield scores in the high 80s, while CodeContests yields scores in the low 30s, indicating it is a significantly more challenging task.
2. **Impact of Ablations:** The effect of removing a component (KB, ER, SF, LDB) is not uniform; it depends on the benchmark.
* The **w/o ER** (orange) variant is consistently among the lowest performers in every benchmark, suggesting the "ER" component is critical for performance.
* The **w/o KB** (medium blue) variant sometimes outperforms "Ours" (e.g., APPS-Interv.), suggesting the "KB" component may have a neutral or slightly negative effect on certain tasks.
3. **"Ours" Performance:** The full method ("Ours") is generally a top performer but is not always the absolute best. It is either the best or tied for best in 4 out of 6 benchmarks (APPS-Intro., CodeContests, HumanEval+, MBPP+).
### Interpretation
This chart is an **ablation study**, a common analysis in machine learning research. Its purpose is to isolate and quantify the contribution of individual components (Knowledge Base - KB, Execution Results - ER, Solution Filter - SF, Large-scale Debugging - LDB) to the overall performance of a proposed system ("Ours").
The data suggests that:
* The **ER (Execution Results)** component is the most vital, as its removal leads to the most consistent and significant performance degradation.
* The system's strength is **benchmark-dependent**. It excels on introductory and standard evaluation sets (APPS-Intro., HumanEval+, MBPP+) but struggles on competition-level problems (CodeContests, APPS-Comp.), where even the full model's performance is modest.
* The **KB (Knowledge Base)** component's role is nuanced. Its removal sometimes helps, sometimes hurts, and sometimes has little effect. This could imply that the knowledge base is either redundant for some tasks or that its integration method needs refinement to avoid negative interference.
* The close performance of "Ours" and "w/o SF" on HumanEval+ (both 87.8%) indicates the **Solution Filter** may have minimal impact on that specific benchmark.
In summary, the chart provides evidence that the proposed method's architecture is effective, with the Execution Results component being a key driver of its success. It also clearly identifies the harder problem domains (competition-level code generation) where future research should focus.