## Diagram: Belief Update Process
### Overview
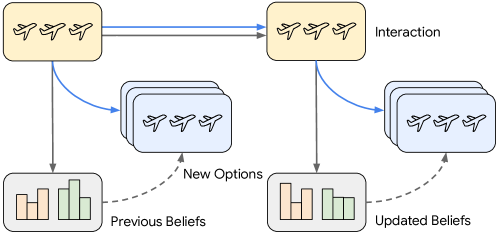
The image is a diagram illustrating a belief update process, likely in the context of decision-making or reinforcement learning. It shows how initial options and beliefs are updated through interaction, leading to new options and updated beliefs.
### Components/Axes
* **Top-Left Box:** Represents the initial state or options. It contains four airplane icons and has a yellow background.
* **Top-Right Box:** Represents the state or options after interaction. It also contains four airplane icons and has a yellow background. The label "Interaction" is to the right of this box.
* **Middle-Left Stacked Boxes:** Represents new options derived from the initial state. It contains three stacked boxes with airplane icons and has a light blue background.
* **Middle-Right Stacked Boxes:** Represents new options derived from the interacted state. It contains three stacked boxes with airplane icons and has a light blue background.
* **Bottom-Left Box:** Represents previous beliefs. It contains a bar chart with two orange bars and two green bars.
* **Bottom-Right Box:** Represents updated beliefs. It contains a bar chart with two orange bars and two green bars.
* **Arrows:**
* Blue arrow from the top-left box to the middle-left stacked boxes.
* Gray arrow from the top-left box to the bottom-left box.
* Blue arrow from the top-right box to the middle-right stacked boxes.
* Gray arrow from the top-right box to the bottom-right box.
* Dashed gray arrow from the bottom-left box to the middle-left stacked boxes, labeled "New Options".
* Dashed gray arrow from the bottom-right box to the middle-right stacked boxes, labeled "New Options".
* Blue arrow connecting the top-left and top-right boxes.
### Detailed Analysis or Content Details
* **Initial State (Top-Left):** The yellow box at the top-left contains four airplane icons, suggesting a set of initial options or states.
* **Interaction (Top-Right):** The yellow box at the top-right, labeled "Interaction," also contains four airplane icons, indicating the state after some interaction or action. A blue arrow connects the initial state to this interacted state, showing the flow of information or action.
* **New Options (Middle-Left & Middle-Right):** The stacked light blue boxes represent new options generated from the initial and interacted states. The dashed gray arrows from the "Previous Beliefs" and "Updated Beliefs" boxes to these "New Options" boxes suggest that beliefs influence the generation of new options.
* **Beliefs (Bottom-Left & Bottom-Right):** The bar charts represent beliefs associated with the states. The "Previous Beliefs" chart shows two orange bars and two green bars, while the "Updated Beliefs" chart shows a similar configuration, but the heights of the bars appear to be slightly different.
* **Previous Beliefs:** The approximate heights of the bars are: Orange bar 1: 0.6, Orange bar 2: 0.8, Green bar 1: 1.0, Green bar 2: 0.9.
* **Updated Beliefs:** The approximate heights of the bars are: Orange bar 1: 0.7, Orange bar 2: 0.6, Green bar 1: 0.9, Green bar 2: 0.8.
### Key Observations
* The diagram illustrates a cyclical process where initial options and beliefs are updated through interaction, leading to new options and updated beliefs.
* The dashed arrows from the belief states to the new options suggest that beliefs influence the generation of new options.
* The changes in the bar chart heights from "Previous Beliefs" to "Updated Beliefs" indicate that the interaction leads to a change in beliefs.
### Interpretation
The diagram represents a belief update mechanism, possibly within a reinforcement learning or decision-making framework. The agent starts with initial options and beliefs. Through interaction with the environment (or another agent), the agent updates its beliefs and generates new options. This process is iterative, allowing the agent to learn and adapt over time. The bar charts representing beliefs likely correspond to the probabilities or values assigned to different options or states. The changes in bar heights indicate that the interaction has caused the agent to revise its assessment of these options. The dashed arrows highlight the influence of existing beliefs on the exploration of new options, suggesting a balance between exploitation (using current beliefs) and exploration (generating new options).