\n
## Diagram: Belief-Option-Interaction Loop
### Overview
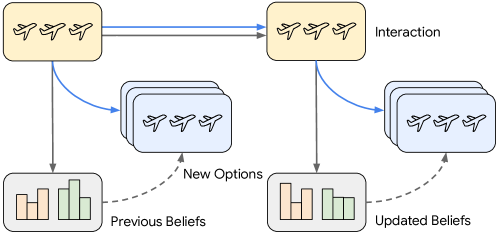
The image depicts a cyclical diagram illustrating a belief-option-interaction loop. It shows how initial beliefs lead to options, interaction with those options results in updated beliefs, and this process repeats. The diagram uses stylized airplane icons to represent options and bar charts to represent beliefs. Arrows indicate the flow of information and influence.
### Components/Axes
The diagram consists of four main components arranged in a loop:
1. **Initial Beliefs:** Represented by a bar chart with three bars, colored orange, grey, and green.
2. **New Options:** Represented by a stack of rectangles with airplane icons.
3. **Interaction:** Represented by a rectangle with airplane icons.
4. **Updated Beliefs:** Represented by a bar chart with three bars, colored orange, grey, and green.
The diagram also includes the following labels:
* "Previous Beliefs" - a dashed arrow pointing from the Initial Beliefs to New Options.
* "New Options" - a solid arrow pointing from New Options to Interaction.
* "Interaction" - a label placed above the Interaction rectangle.
* "Updated Beliefs" - a dashed arrow pointing from Interaction to Updated Beliefs.
Arrows are used to show the flow of information. Solid arrows represent direct influence, while dashed arrows represent a more indirect or iterative influence.
### Detailed Analysis or Content Details
The diagram shows a loop starting with "Previous Beliefs" (represented by the bar chart). This leads to "New Options" (the stack of rectangles with airplanes). Interaction with these options (the "Interaction" rectangle) results in "Updated Beliefs" (the second bar chart). The "Updated Beliefs" then feed back into the loop, influencing the "New Options" in the next iteration.
The bar charts in "Previous Beliefs" and "Updated Beliefs" appear to have three categories, represented by the orange, grey, and green bars. The heights of the bars are visually different, suggesting varying degrees of belief in each category. The exact values are not provided.
The airplane icons in "New Options" and "Interaction" are identical, suggesting that the options remain consistent throughout the interaction process.
### Key Observations
* The loop structure emphasizes the iterative nature of belief updating.
* The use of dashed arrows for "Previous Beliefs" and "Updated Beliefs" suggests that these influences are not deterministic but rather contribute to the overall process.
* The bar charts visually represent the strength of beliefs in different categories.
* The diagram does not provide any quantitative data, focusing instead on the conceptual flow of information.
### Interpretation
This diagram illustrates a cognitive process where beliefs influence the options considered, interaction with those options leads to new information, and this information updates the beliefs. This is a simplified model of Bayesian updating or reinforcement learning, where prior beliefs are updated based on new evidence. The diagram highlights the cyclical nature of this process, suggesting that beliefs are constantly being refined through interaction with the world.
The use of airplanes as options could suggest a domain where choices involve travel or transportation. However, the diagram is abstract enough that the specific domain is not critical to the underlying concept. The diagram is a conceptual illustration of a feedback loop, rather than a presentation of specific data. It is a visual metaphor for how we learn and adapt our beliefs based on experience.