## Bar Charts: MUSE and Dreamer-v3 Performance Comparison
### Overview
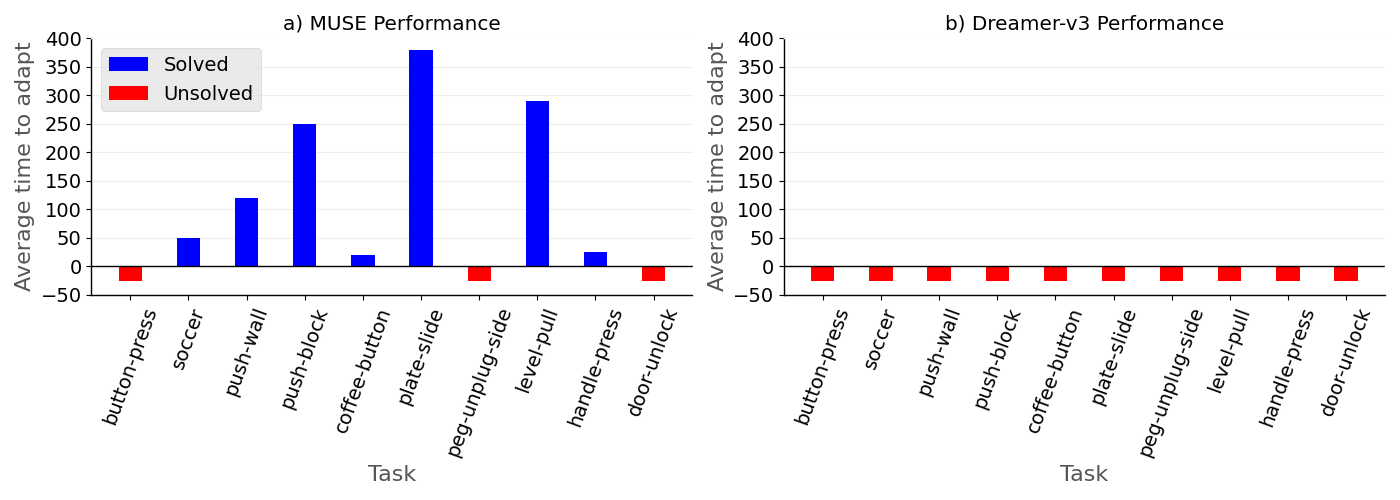
The image contains two side-by-side bar charts comparing performance metrics for two systems: MUSE and Dreamer-v3. Both charts measure "Average time to adapt" across 10 tasks, with MUSE showing solved/unsolved task distinctions and Dreamer-v3 displaying uniform performance.
### Components/Axes
**MUSE Performance (Left Chart):**
- **X-axis (Tasks):** 10 tasks listed left-to-right:
`button-press`, `soccer`, `push-wall`, `push-block`, `coffee-button`, `plate-slide`, `peg-unplug-side`, `level-pull`, `handle-press`, `door-unlock`
- **Y-axis (Time):** Ranges from -50 to 400 (units unspecified, likely milliseconds or seconds)
- **Legend:**
- Blue bars = Solved tasks
- Red bars = Unsolved tasks
- Positioned in top-left corner
**Dreamer-v3 Performance (Right Chart):**
- **X-axis (Tasks):** Same 10 tasks as MUSE chart
- **Y-axis (Time):** Identical scale (-50 to 400)
- **Legend:**
- Red bars = All tasks (no distinction between solved/unsolved)
- Positioned in top-left corner
### Detailed Analysis
**MUSE Performance:**
- **Solved Tasks (Blue):**
- `button-press`: ~50
- `soccer`: ~50
- `push-wall`: ~120
- `push-block`: ~250
- `coffee-button`: ~20
- `plate-slide`: ~380 (tallest bar)
- `peg-unplug-side`: ~280
- `level-pull`: ~30
- `handle-press`: ~30
- `door-unlock`: ~0
- **Unsolved Tasks (Red):**
- All tasks show identical value: **-50** (below y-axis baseline)
**Dreamer-v3 Performance:**
- All tasks show identical value: **0** (aligned with y-axis baseline)
### Key Observations
1. **MUSE Variability:**
- Performance varies significantly across tasks (e.g., `plate-slide` takes ~380 units vs. `coffee-button` at ~20 units).
- `door-unlock` shows no time cost (0), while `door-unlock` in MUSE is unsolved (-50).
2. **Dreamer-v3 Uniformity:**
- No variation in performance across tasks (all 0).
- Contrasts sharply with MUSE's task-specific results.
3. **Unsolved Task Baseline:**
- MUSE's unsolved tasks consistently show -50, suggesting a fixed penalty or error state.
### Interpretation
- **MUSE Performance:**
The system demonstrates task-dependent adaptation, with complex tasks (`plate-slide`, `push-block`) requiring significantly more time. The -50 baseline for unsolved tasks may indicate a default failure state or measurement artifact.
- **Dreamer-v3 Performance:**
The uniform 0 value suggests either:
1. A fixed, non-adaptive approach to all tasks, or
2. A system that either always succeeds (0 time) or fails catastrophically (not represented here).
- **Critical Insight:**
MUSE's performance correlates with task complexity, while Dreamer-v3's uniformity implies a lack of task-specific optimization. The -50 unsolved baseline in MUSE warrants further investigation into error handling mechanisms.