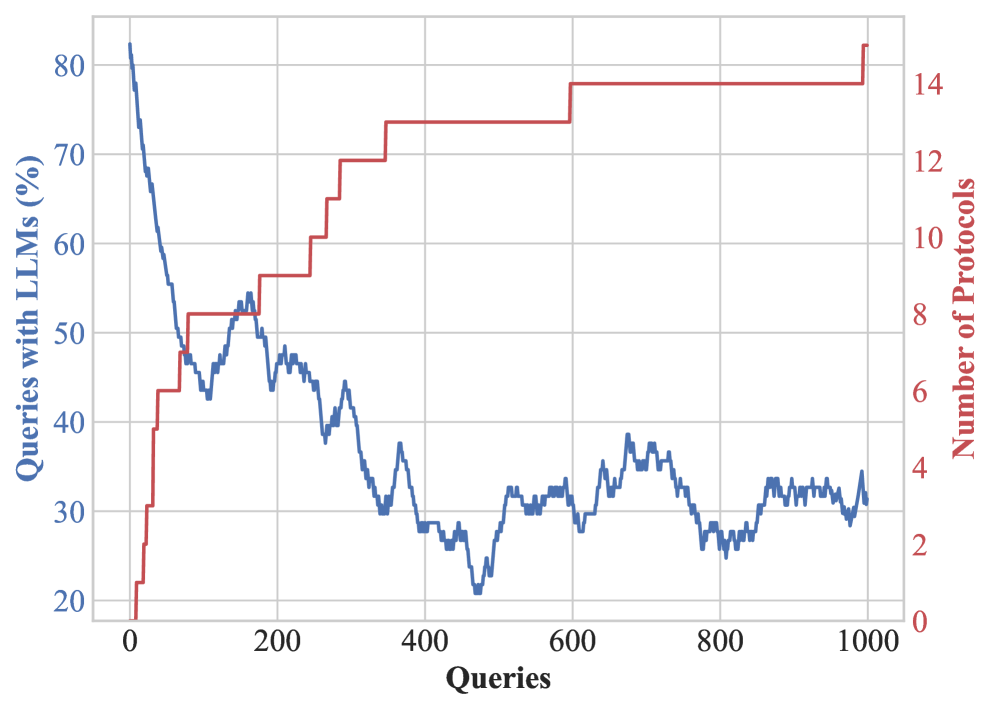
## Line Chart: Queries with LLMs (%) vs. Number of Protocols over Queries
### Overview
This image displays a line chart with two y-axes and a shared x-axis. The chart plots two data series representing the percentage of queries handled by Large Language Models (LLMs) and the number of protocols used, both as a function of the total number of queries processed.
### Components/Axes
* **X-axis:**
* **Title:** Queries
* **Scale:** Linear, ranging from 0 to 1000. Major tick marks are present at 0, 200, 400, 600, 800, and 1000.
* **Left Y-axis:**
* **Title:** Queries with LLMs (%)
* **Scale:** Linear, ranging from 0 to 80. Major tick marks are present at 20, 40, 60, and 80. The axis label is oriented vertically.
* **Right Y-axis:**
* **Title:** Number of Protocols
* **Scale:** Linear, ranging from 0 to 14. Major tick marks are present at 0, 2, 4, 6, 8, 10, 12, and 14. The axis label is oriented vertically.
* **Data Series:**
* **Blue Line:** Represents "Queries with LLMs (%)".
* **Red Line:** Represents "Number of Protocols".
### Detailed Analysis
**Blue Line (Queries with LLMs (%))**:
This line starts at approximately 82% at 0 queries. It then exhibits a steep downward trend, reaching around 42% at approximately 100 queries. From 100 to about 250 queries, it fluctuates between approximately 42% and 53%. After 250 queries, the trend is generally downward, with significant fluctuations, reaching a low of approximately 25% around 780 queries. It then shows a slight upward trend to about 32% at 900 queries, followed by a decrease to approximately 30% at 1000 queries.
* **Approximate Key Points (Queries, Percentage):**
* (0, 82)
* (50, 58)
* (100, 42)
* (150, 52)
* (200, 48)
* (250, 53)
* (300, 45)
* (350, 35)
* (400, 28)
* (450, 33)
* (500, 31)
* (550, 32)
* (600, 31)
* (650, 34)
* (700, 32)
* (750, 27)
* (800, 25)
* (850, 30)
* (900, 32)
* (950, 30)
* (1000, 30)
**Red Line (Number of Protocols)**:
This line starts at 0 protocols at 0 queries. It shows a step-wise increase.
* It remains at 0 protocols until approximately 20 queries.
* Increases to 2 protocols around 20 queries and stays there until approximately 50 queries.
* Increases to 4 protocols around 50 queries and stays there until approximately 100 queries.
* Increases to 6 protocols around 100 queries and stays there until approximately 150 queries.
* Increases to 8 protocols around 150 queries and stays there until approximately 200 queries.
* Increases to 10 protocols around 200 queries and stays there until approximately 300 queries.
* Increases to 12 protocols around 300 queries and stays there until approximately 400 queries.
* Increases to 14 protocols around 400 queries and stays there until approximately 1000 queries.
* **Approximate Key Points (Queries, Number of Protocols):**
* (0, 0)
* (20, 2)
* (50, 4)
* (100, 6)
* (150, 8)
* (200, 10)
* (300, 12)
* (400, 14)
* (1000, 14)
### Key Observations
* There is a strong inverse correlation observed between the "Queries with LLMs (%)" and the "Number of Protocols" in the initial phase of the queries. As the number of protocols increases, the percentage of queries handled by LLMs generally decreases.
* The "Number of Protocols" increases in discrete steps, suggesting a system where protocols are added or enabled at certain query thresholds.
* The "Queries with LLMs (%)" shows a significant initial drop, then fluctuates, and eventually stabilizes at a lower percentage as the number of protocols reaches its maximum.
* The most pronounced decrease in LLM usage occurs when the number of protocols is increasing from 0 to 10.
* Once the number of protocols reaches 14 (around 400 queries), the "Queries with LLMs (%)" appears to stabilize within a range of approximately 25% to 35%, despite continued fluctuations.
### Interpretation
The data suggests a system where the introduction or increase in the number of protocols leads to a decrease in the proportion of queries handled by LLMs. This could imply that as more complex or specialized protocols are introduced, the system relies less on general-purpose LLMs and more on specific protocol handlers.
The step-wise increase in the "Number of Protocols" indicates a controlled or staged rollout of these protocols. The initial sharp decline in LLM usage (from ~82% to ~42% within the first 100 queries) coincides with the initial increases in protocols (from 0 to 6). This suggests that the early addition of protocols has the most significant impact on reducing LLM reliance.
The subsequent fluctuations in LLM usage after the number of protocols stabilizes at 14 might represent the dynamic nature of query routing or the interaction between LLMs and the various protocols. The stabilization of LLM usage within a certain range (25-35%) after reaching the maximum number of protocols could indicate that the system has reached a steady state where LLMs handle a baseline percentage of queries, possibly for tasks not covered by the existing protocols or for fallback mechanisms.
In essence, the chart demonstrates a trade-off or a shift in query handling strategy as the system's protocol complexity increases. The system appears to be designed to offload more specific tasks to dedicated protocols as they become available, thereby reducing the burden on general LLMs. This could be for reasons of efficiency, accuracy for specific tasks, or cost.