## Line Chart: LLM Query Performance & Protocol Count
### Overview
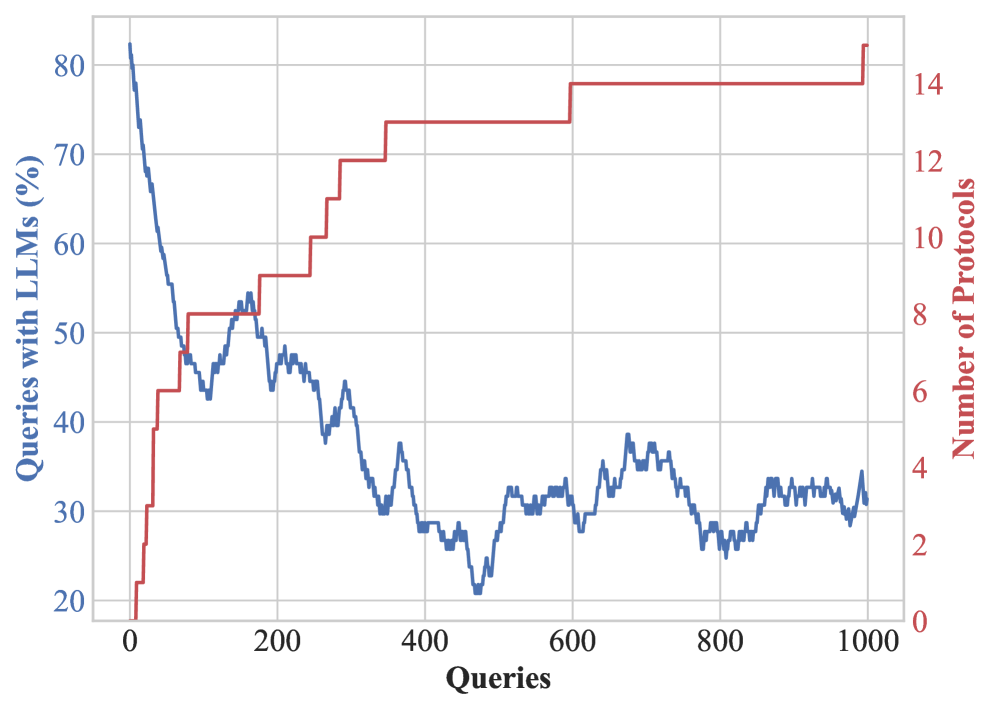
The image presents a line chart displaying two metrics over a range of queries: the percentage of queries handled by Large Language Models (LLMs) and the number of protocols in use. The x-axis represents the number of queries, ranging from 0 to 1000. The left y-axis shows the percentage of queries with LLMs, scaled from 20% to 80%. The right y-axis displays the number of protocols, scaled from 0 to 14.
### Components/Axes
* **X-axis:** Queries (0 to 1000)
* **Left Y-axis:** Queries with LLMs (%) (20 to 80)
* **Right Y-axis:** Number of Protocols (0 to 14)
* **Line 1 (Red):** Percentage of Queries with LLMs
* **Line 2 (Blue):** Number of Protocols
### Detailed Analysis
**Red Line (Percentage of Queries with LLMs):**
The red line starts at approximately 80% at 0 queries and exhibits a steep downward trend, reaching a low of around 25% at approximately 100 queries. It then fluctuates between 40% and 70% from 100 to 600 queries, with several step-like increases. From 600 to 800 queries, the line plateaus around 75-80%. Finally, it increases slightly to approximately 82% at 1000 queries.
* 0 Queries: ~80%
* 100 Queries: ~25%
* 200 Queries: ~55%
* 300 Queries: ~65%
* 400 Queries: ~50%
* 500 Queries: ~70%
* 600 Queries: ~75%
* 700 Queries: ~80%
* 800 Queries: ~80%
* 900 Queries: ~80%
* 1000 Queries: ~82%
**Blue Line (Number of Protocols):**
The blue line begins at approximately 4 protocols at 0 queries and decreases to a minimum of around 2 protocols at approximately 300 queries. It then oscillates between 2 and 5 protocols from 300 to 900 queries, exhibiting a generally fluctuating pattern. The line ends at approximately 3 protocols at 1000 queries.
* 0 Queries: ~4
* 100 Queries: ~3.5
* 200 Queries: ~3
* 300 Queries: ~2
* 400 Queries: ~3
* 500 Queries: ~4
* 600 Queries: ~4.5
* 700 Queries: ~3.5
* 800 Queries: ~3
* 900 Queries: ~3.5
* 1000 Queries: ~3
### Key Observations
* The percentage of queries handled by LLMs initially decreases significantly, then stabilizes with fluctuations.
* The number of protocols used generally decreases initially and then fluctuates within a narrow range.
* There appears to be a weak inverse correlation between the percentage of LLM queries and the number of protocols. When LLM usage increases, the number of protocols tends to decrease, and vice versa.
* The red line exhibits several step-like increases, suggesting discrete changes in LLM usage thresholds or configurations.
### Interpretation
The chart suggests a dynamic relationship between the adoption of LLMs for query processing and the overall system architecture (as represented by the number of protocols). The initial decline in LLM usage could be due to a period of experimentation or optimization where LLMs were not initially effective for all query types. The subsequent stabilization and increases in LLM usage indicate successful integration and increasing reliance on LLMs. The fluctuating number of protocols suggests that the system is adapting to the changing workload and LLM capabilities, potentially adding or removing protocols as needed. The inverse correlation hints at a trade-off: as LLMs handle more queries, the need for more complex protocols might decrease. The step-like increases in LLM usage suggest deliberate adjustments to the system's configuration, possibly based on performance metrics or cost considerations. The data suggests a system that is evolving and optimizing its use of LLMs over time.