\n
## Dual-Axis Line Chart: LLM Query Performance vs. Protocol Count Over Queries
### Overview
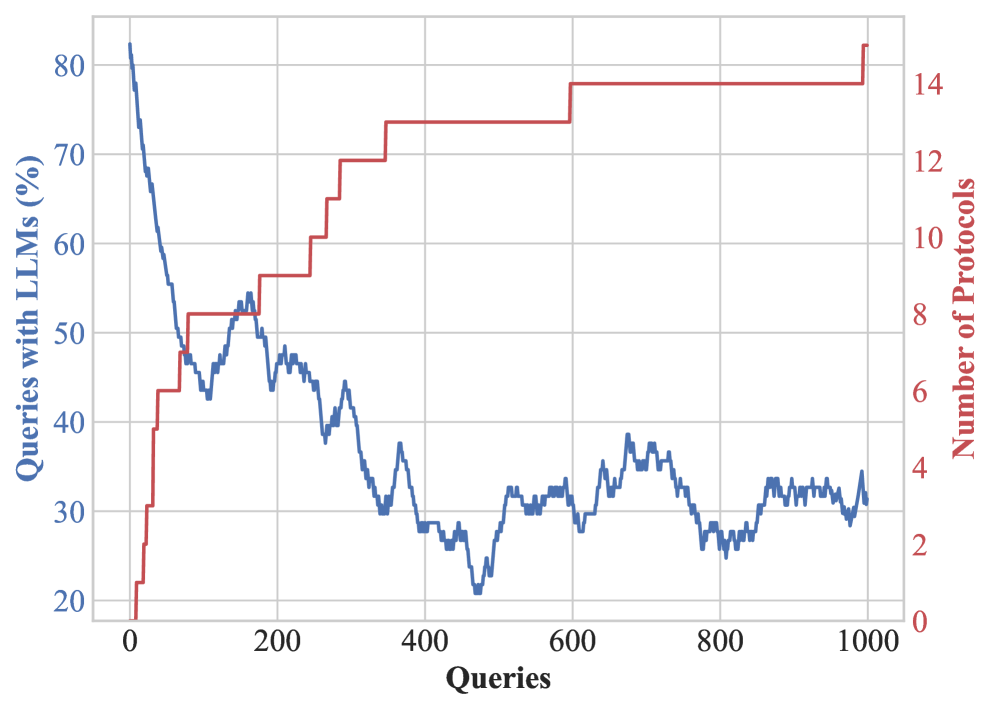
The image displays a dual-axis line chart plotting two distinct metrics against a common x-axis representing the number of queries. The chart illustrates the relationship between the percentage of queries involving Large Language Models (LLMs) and the cumulative number of protocols implemented over a sequence of 1000 queries.
### Components/Axes
* **X-Axis (Bottom):** Labeled **"Queries"**. It is a linear scale ranging from 0 to 1000, with major tick marks at intervals of 200 (0, 200, 400, 600, 800, 1000).
* **Primary Y-Axis (Left):** Labeled **"Queries with LLMs (%)"**. It is a linear scale ranging from 20 to 80, with major tick marks at intervals of 10 (20, 30, 40, 50, 60, 70, 80). The data series for this axis is plotted in **blue**.
* **Secondary Y-Axis (Right):** Labeled **"Number of Protocols"**. It is a linear scale ranging from 0 to 14, with major tick marks at intervals of 2 (0, 2, 4, 6, 8, 10, 12, 14). The data series for this axis is plotted in **red**.
* **Legend:** There is no explicit legend box. The association between line color and axis is implied by the color of the axis labels and titles. The **blue line** corresponds to the left axis ("Queries with LLMs (%)"), and the **red line** corresponds to the right axis ("Number of Protocols").
### Detailed Analysis
**1. Blue Line Series ("Queries with LLMs (%)"):**
* **Trend:** The line shows a sharp initial decline followed by high volatility with an overall downward trend.
* **Key Data Points (Approximate):**
* Starts at its peak of ~82% at Query 0.
* Drops steeply to ~50% by approximately Query 50.
* Experiences a local peak of ~54% around Query 150.
* Enters a volatile decline, reaching its lowest point of ~21% near Query 470.
* After the low, it fluctuates between ~25% and ~38% for the remainder of the chart, ending at approximately 32% at Query 1000.
**2. Red Line Series ("Number of Protocols"):**
* **Trend:** The line is a step function, showing a non-decreasing, cumulative count that increases in discrete jumps.
* **Key Data Points (Approximate):**
* Starts at 0 protocols at Query 0.
* First increase to 1 protocol occurs very early, before Query 20.
* Jumps to 6 protocols around Query 50.
* Increases to 8 protocols near Query 100.
* Steps up to 9 protocols around Query 200.
* Increases to 10 protocols near Query 250.
* Jumps to 11 protocols around Query 280.
* Steps up to 12 protocols near Query 320.
* Increases to 13 protocols around Query 350.
* Jumps to 14 protocols near Query 600.
* Final increase to 15 protocols occurs just before Query 1000.
### Key Observations
1. **Inverse Relationship:** There is a clear inverse correlation between the two series. As the number of protocols (red line) increases in steps, the percentage of queries using LLMs (blue line) generally decreases.
2. **Volatility vs. Stability:** The "Queries with LLMs" metric is highly volatile, reacting sharply to changes. In contrast, the "Number of Protocols" is stable between increments, only changing at specific, discrete points.
3. **Stabilization Zone:** After approximately Query 600, when the protocol count reaches 14, the blue line's volatility reduces, and it oscillates within a narrower band (roughly 25-35%), suggesting a new, lower equilibrium.
4. **Initial Phase:** The most dramatic changes occur in the first 100 queries, where the LLM usage plummets from >80% to ~50% as the first 8 protocols are rapidly introduced.
### Interpretation
The data suggests a system where the introduction of structured protocols directly reduces the reliance on or need for LLM-based query handling. The stepwise increase in protocols implies they are being added or activated in batches. The initial, rapid deployment of protocols has the most significant impact, drastically cutting LLM usage. The subsequent, smaller protocol additions continue to suppress LLM query percentage, albeit with diminishing returns, as the system stabilizes. The volatility in the blue line indicates that LLM usage is sensitive to the specific queries being processed, but the overall trend is decisively downward as the protocol framework becomes more comprehensive. This chart likely demonstrates the effectiveness of a rule-based or protocol-driven system in supplanting a more general, LLM-based approach for a specific task domain.