## Chart: State Prediction Accuracy in Maze
### Overview
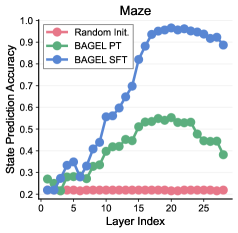
The image is a line chart comparing the state prediction accuracy of three different methods (Random Initialization, BAGEL PT, and BAGEL SFT) across different layers in a maze. The x-axis represents the layer index, and the y-axis represents the state prediction accuracy.
### Components/Axes
* **Title:** Maze
* **X-axis:** Layer Index (values from 0 to 25, incrementing by 5)
* **Y-axis:** State Prediction Accuracy (values from 0.2 to 1.0, incrementing by 0.1)
* **Legend:** Located in the top-left corner.
* Random Init. (Red)
* BAGEL PT (Green)
* BAGEL SFT (Blue)
### Detailed Analysis
* **Random Init. (Red):** The accuracy remains relatively constant at approximately 0.2 for all layer indices.
* Layer 0: ~0.22
* Layer 25: ~0.22
* **BAGEL PT (Green):** The accuracy increases from approximately 0.25 to a peak around 0.55, then decreases slightly.
* Layer 0: ~0.25
* Layer 15: ~0.55
* Layer 25: ~0.45
* **BAGEL SFT (Blue):** The accuracy increases sharply from approximately 0.2 to a peak around 0.98, then decreases slightly.
* Layer 0: ~0.22
* Layer 15: ~0.75
* Layer 20: ~0.98
* Layer 25: ~0.93
### Key Observations
* BAGEL SFT significantly outperforms the other two methods in terms of state prediction accuracy.
* BAGEL PT shows some improvement over Random Init., but not as significant as BAGEL SFT.
* Random Init. has the lowest and most consistent accuracy across all layers.
* Both BAGEL PT and BAGEL SFT show a peak in accuracy before decreasing slightly in later layers.
### Interpretation
The chart demonstrates that BAGEL SFT is the most effective method for state prediction in the maze environment, achieving significantly higher accuracy compared to BAGEL PT and Random Initialization. The performance of BAGEL PT suggests some level of learning, but it is not as effective as BAGEL SFT. The consistent low accuracy of Random Initialization indicates that it does not learn or adapt to the maze environment. The peak in accuracy for BAGEL PT and BAGEL SFT, followed by a slight decrease, could indicate overfitting or diminishing returns in later layers.