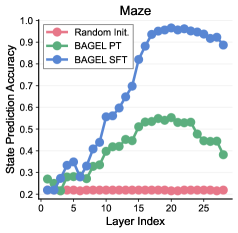
## Line Chart: Maze State Prediction Accuracy
### Overview
The chart visualizes the state prediction accuracy of three different initialization methods across 25 layers in a maze environment. Three data series are plotted: "Random Init." (red), "BAGEL PT" (green), and "BAGEL SFT" (blue). The y-axis represents accuracy (0.2–1.0), while the x-axis represents layer indices (0–25).
### Components/Axes
- **X-axis (Layer Index)**: Discrete values from 0 to 25, incrementing by 5.
- **Y-axis (State Prediction Accuracy)**: Continuous scale from 0.2 to 1.0, with gridlines at 0.1 intervals.
- **Legend**: Positioned at the top-right corner, with color-coded labels:
- Red: Random Init.
- Green: BAGEL PT
- Blue: BAGEL SFT
### Detailed Analysis
1. **Random Init. (Red Line)**:
- Remains flat at approximately 0.2 across all layers.
- No visible variation or trend.
2. **BAGEL PT (Green Line)**:
- Starts at ~0.2 (layer 0), rises gradually to ~0.55 (layer 15), then declines to ~0.4 (layer 25).
- Peak accuracy observed at layer 15 (~0.55).
- Slight fluctuations between layers 10–20 (~0.45–0.55).
3. **BAGEL SFT (Blue Line)**:
- Begins at ~0.2 (layer 0), rises sharply to ~0.95 (layer 20), then plateaus with minor fluctuations (~0.9–0.95) until layer 25.
- Steep ascent between layers 10–15 (~0.5 to 0.85).
- Highest accuracy among all series.
### Key Observations
- **BAGEL SFT** consistently outperforms other methods, achieving ~0.95 accuracy by layer 20.
- **BAGEL PT** shows a mid-chart peak but underperforms compared to BAGEL SFT.
- **Random Init.** remains static, serving as a baseline.
- BAGEL PT’s decline after layer 15 suggests potential overfitting or diminishing returns.
### Interpretation
The chart demonstrates that **BAGEL SFT** is the most effective initialization method for state prediction in the maze environment, with a significant accuracy advantage over BAGEL PT and Random Init. The sharp rise in BAGEL SFT’s performance (layers 10–20) indicates rapid learning or optimization, while its plateau suggests stabilization. BAGEL PT’s mid-chart peak and subsequent decline may reflect temporary improvements followed by instability or overfitting. Random Init.’s flat line underscores its ineffectiveness as a baseline. These trends highlight the importance of initialization strategies in neural network performance for sequential tasks like maze navigation.