## Line Chart: Accuracy vs. C
### Overview
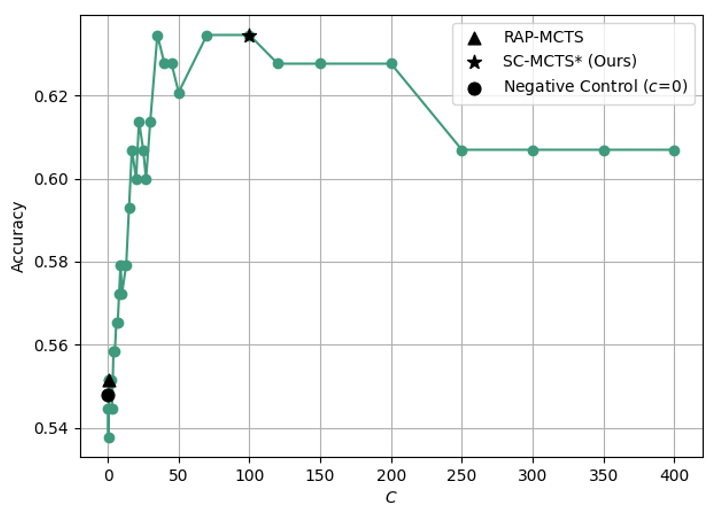
The image is a line chart that plots the accuracy of different algorithms against the parameter 'C'. The chart compares the performance of RAP-MCTS, SC-MCTS* (Ours), and a Negative Control (c=0). The x-axis represents the parameter 'C', and the y-axis represents the accuracy.
### Components/Axes
* **Title:** Implicit, but the chart shows "Accuracy vs. C"
* **X-axis:**
* Label: C
* Scale: 0 to 400, with major ticks at 0, 50, 100, 150, 200, 250, 300, 350, and 400.
* **Y-axis:**
* Label: Accuracy
* Scale: 0.54 to 0.62, with major ticks at 0.54, 0.56, 0.58, 0.60, and 0.62.
* **Legend:** Located in the top-right corner.
* RAP-MCTS: Represented by a black triangle.
* SC-MCTS* (Ours): Represented by a black star.
* Negative Control (c=0): Represented by a black circle.
* **Data Series:** The chart contains one primary data series represented by a teal line with circular markers.
### Detailed Analysis
* **RAP-MCTS:** Represented by a black triangle at approximately (2, 0.55).
* **SC-MCTS* (Ours):** Represented by a black star at approximately (100, 0.63).
* **Negative Control (c=0):** Represented by a black circle at approximately (2, 0.55).
* **Teal Line (Unspecified Algorithm):**
* Trend: The teal line initially increases sharply from C=0 to approximately C=50. It then plateaus around C=50 to C=150, followed by a gradual decrease until C=250. From C=250 to C=400, the line remains relatively constant.
* Data Points:
* C=0, Accuracy=0.54
* C=5, Accuracy=0.55
* C=10, Accuracy=0.57
* C=15, Accuracy=0.58
* C=20, Accuracy=0.60
* C=25, Accuracy=0.60
* C=30, Accuracy=0.61
* C=35, Accuracy=0.61
* C=40, Accuracy=0.63
* C=50, Accuracy=0.63
* C=75, Accuracy=0.63
* C=100, Accuracy=0.63
* C=125, Accuracy=0.63
* C=150, Accuracy=0.63
* C=200, Accuracy=0.63
* C=250, Accuracy=0.61
* C=300, Accuracy=0.61
* C=350, Accuracy=0.61
* C=400, Accuracy=0.61
### Key Observations
* The teal line shows a significant increase in accuracy as 'C' increases from 0 to approximately 50.
* The accuracy plateaus between C=50 and C=150.
* Beyond C=150, the accuracy decreases slightly before stabilizing.
* The RAP-MCTS and Negative Control have similar accuracy values at C=0.
* The SC-MCTS* (Ours) has a higher accuracy than RAP-MCTS and Negative Control.
### Interpretation
The chart suggests that the parameter 'C' has a significant impact on the accuracy of the algorithm represented by the teal line. Increasing 'C' initially leads to a substantial improvement in accuracy, but there are diminishing returns beyond a certain point. The plateau indicates that further increases in 'C' do not significantly improve accuracy, and may even lead to a slight decrease. The SC-MCTS* (Ours) algorithm appears to outperform the RAP-MCTS and Negative Control algorithms. The negative control accuracy is the baseline performance when C=0. The optimal value of C for the teal line algorithm appears to be around 50-150.